Comparisons against some well known benchmark cases are shown here in order to give confidence in the accuracy of calculations using SHORTCUt. The benchmark cases are chosen to be representative of modern ships and propellers.
The results of the benchmark calculations in SHORTCUt are in line with the current state of the art of marine CFD. However, as always with CFD, care must be taken that simulation results are viewed with a critical eye. Significant deviations from the hull/propeller types presented here would warrant further validation in order to confirm accuracy.
This section demonstrates the ability of the two main propeller models included in SHORTCUt to predict the thrust and torque of various propellers with uniform inflow. This is indicative of how well (for a certain advance ratio) they will perform behind the hull in coupled RANS simulations. The presented propellers are those of the known benchmark cases: Japan Bulk Carrier (Bulk Carrier, JBC), Duisburg Test Case (Container ship, DTC), KRISO Container Ship (Container Ship, KCS), KRISO Very Large Crude Carrier v2. (Tanker, KVLCC2) and US Navy Combatant 5415 (Destroyer, DTMB5415).
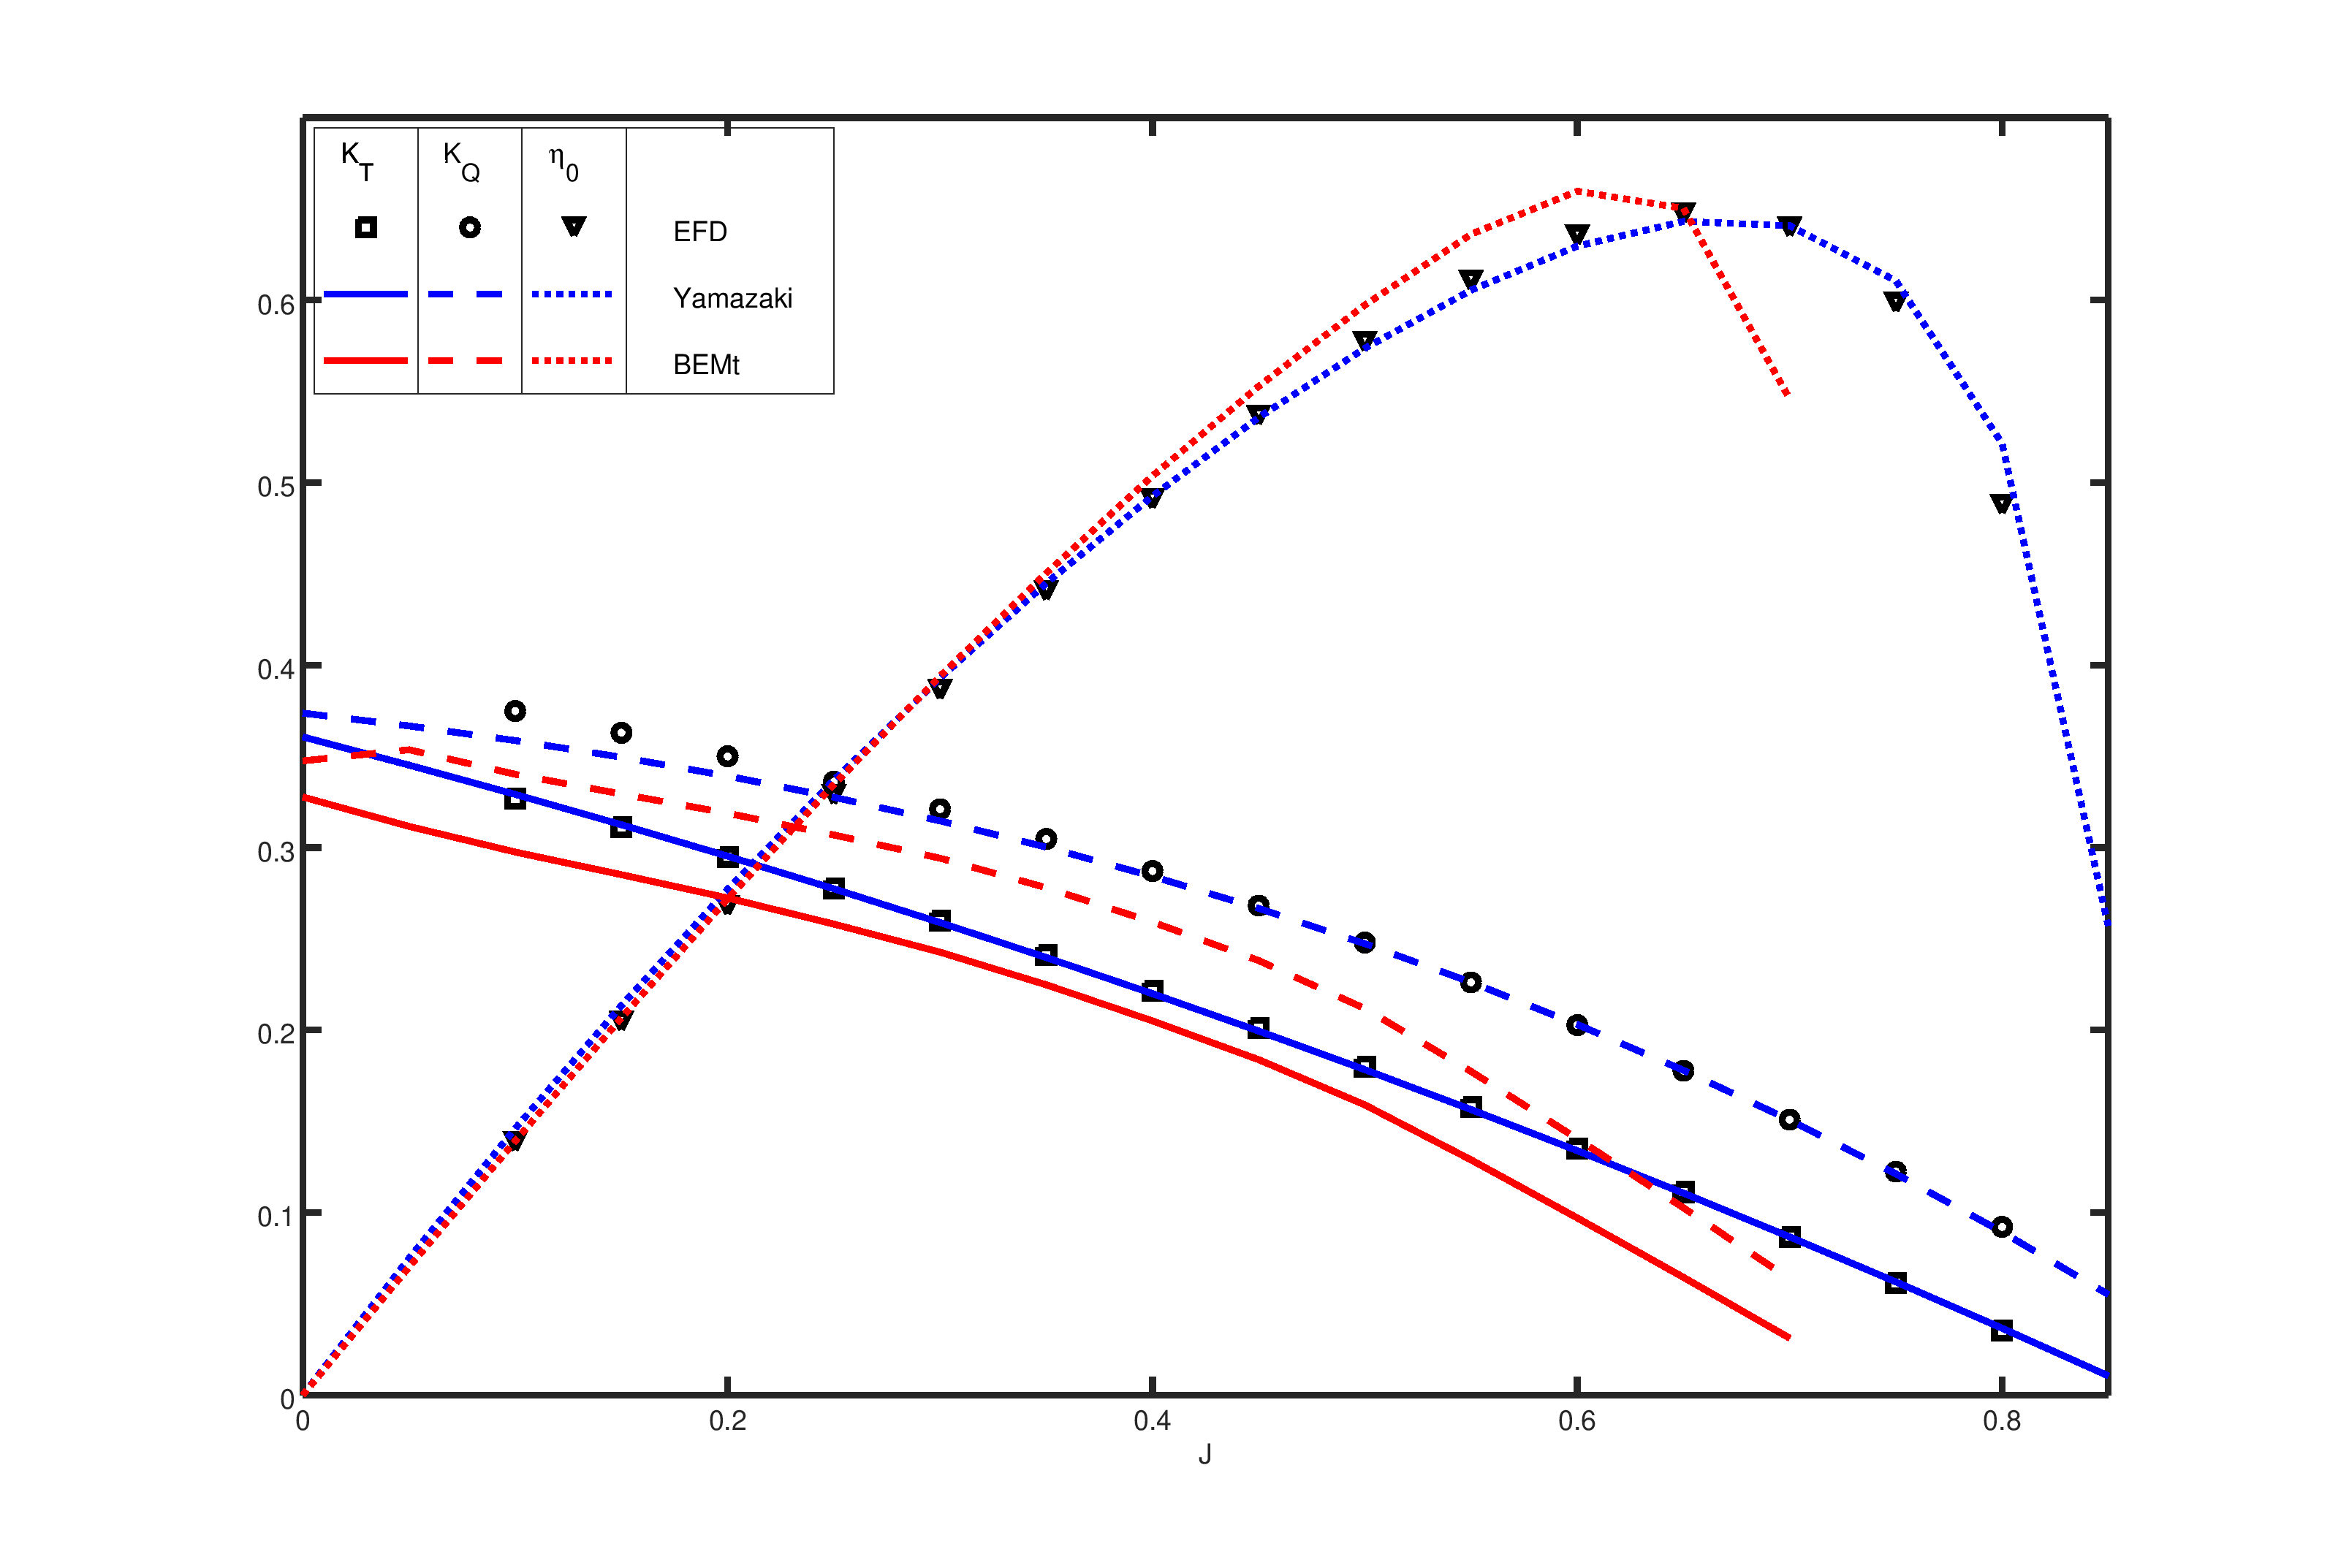
Open water performance of the JBC propeller predicted by SHORTCUt models. Compared to experimental data.
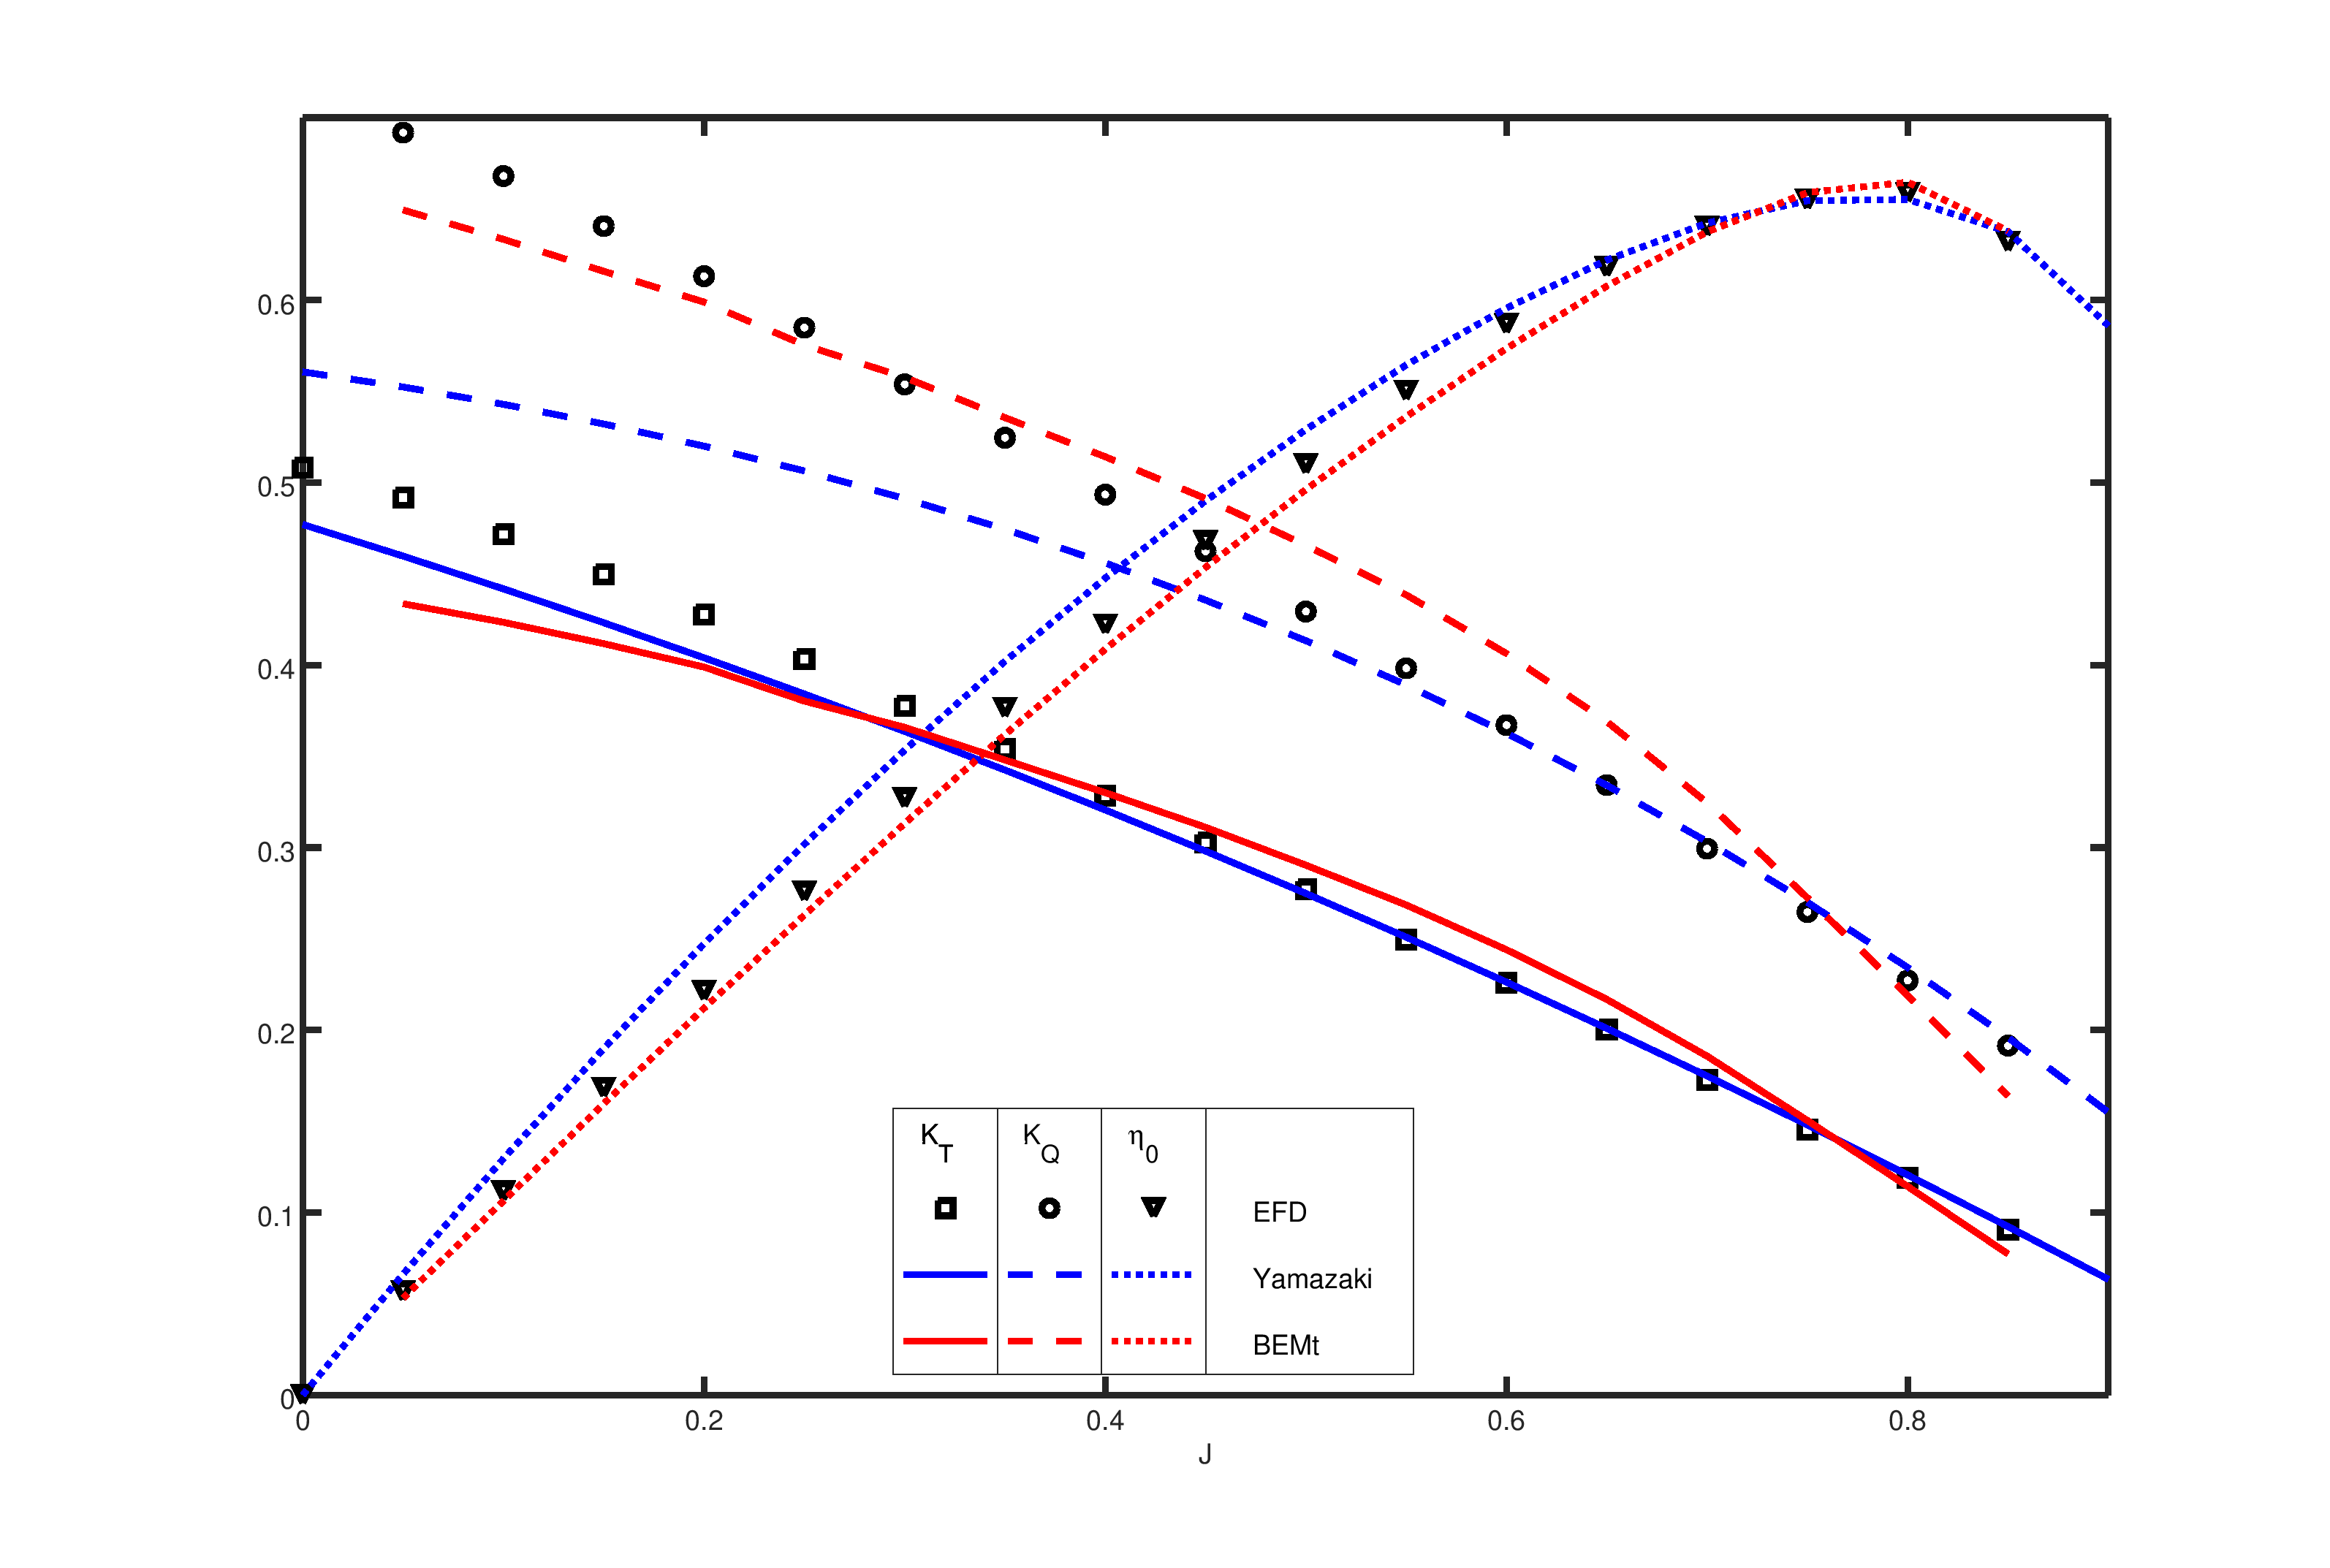
Open water performance of the DTC propeller predicted by SHORTCUt models. Compared to experimental data.
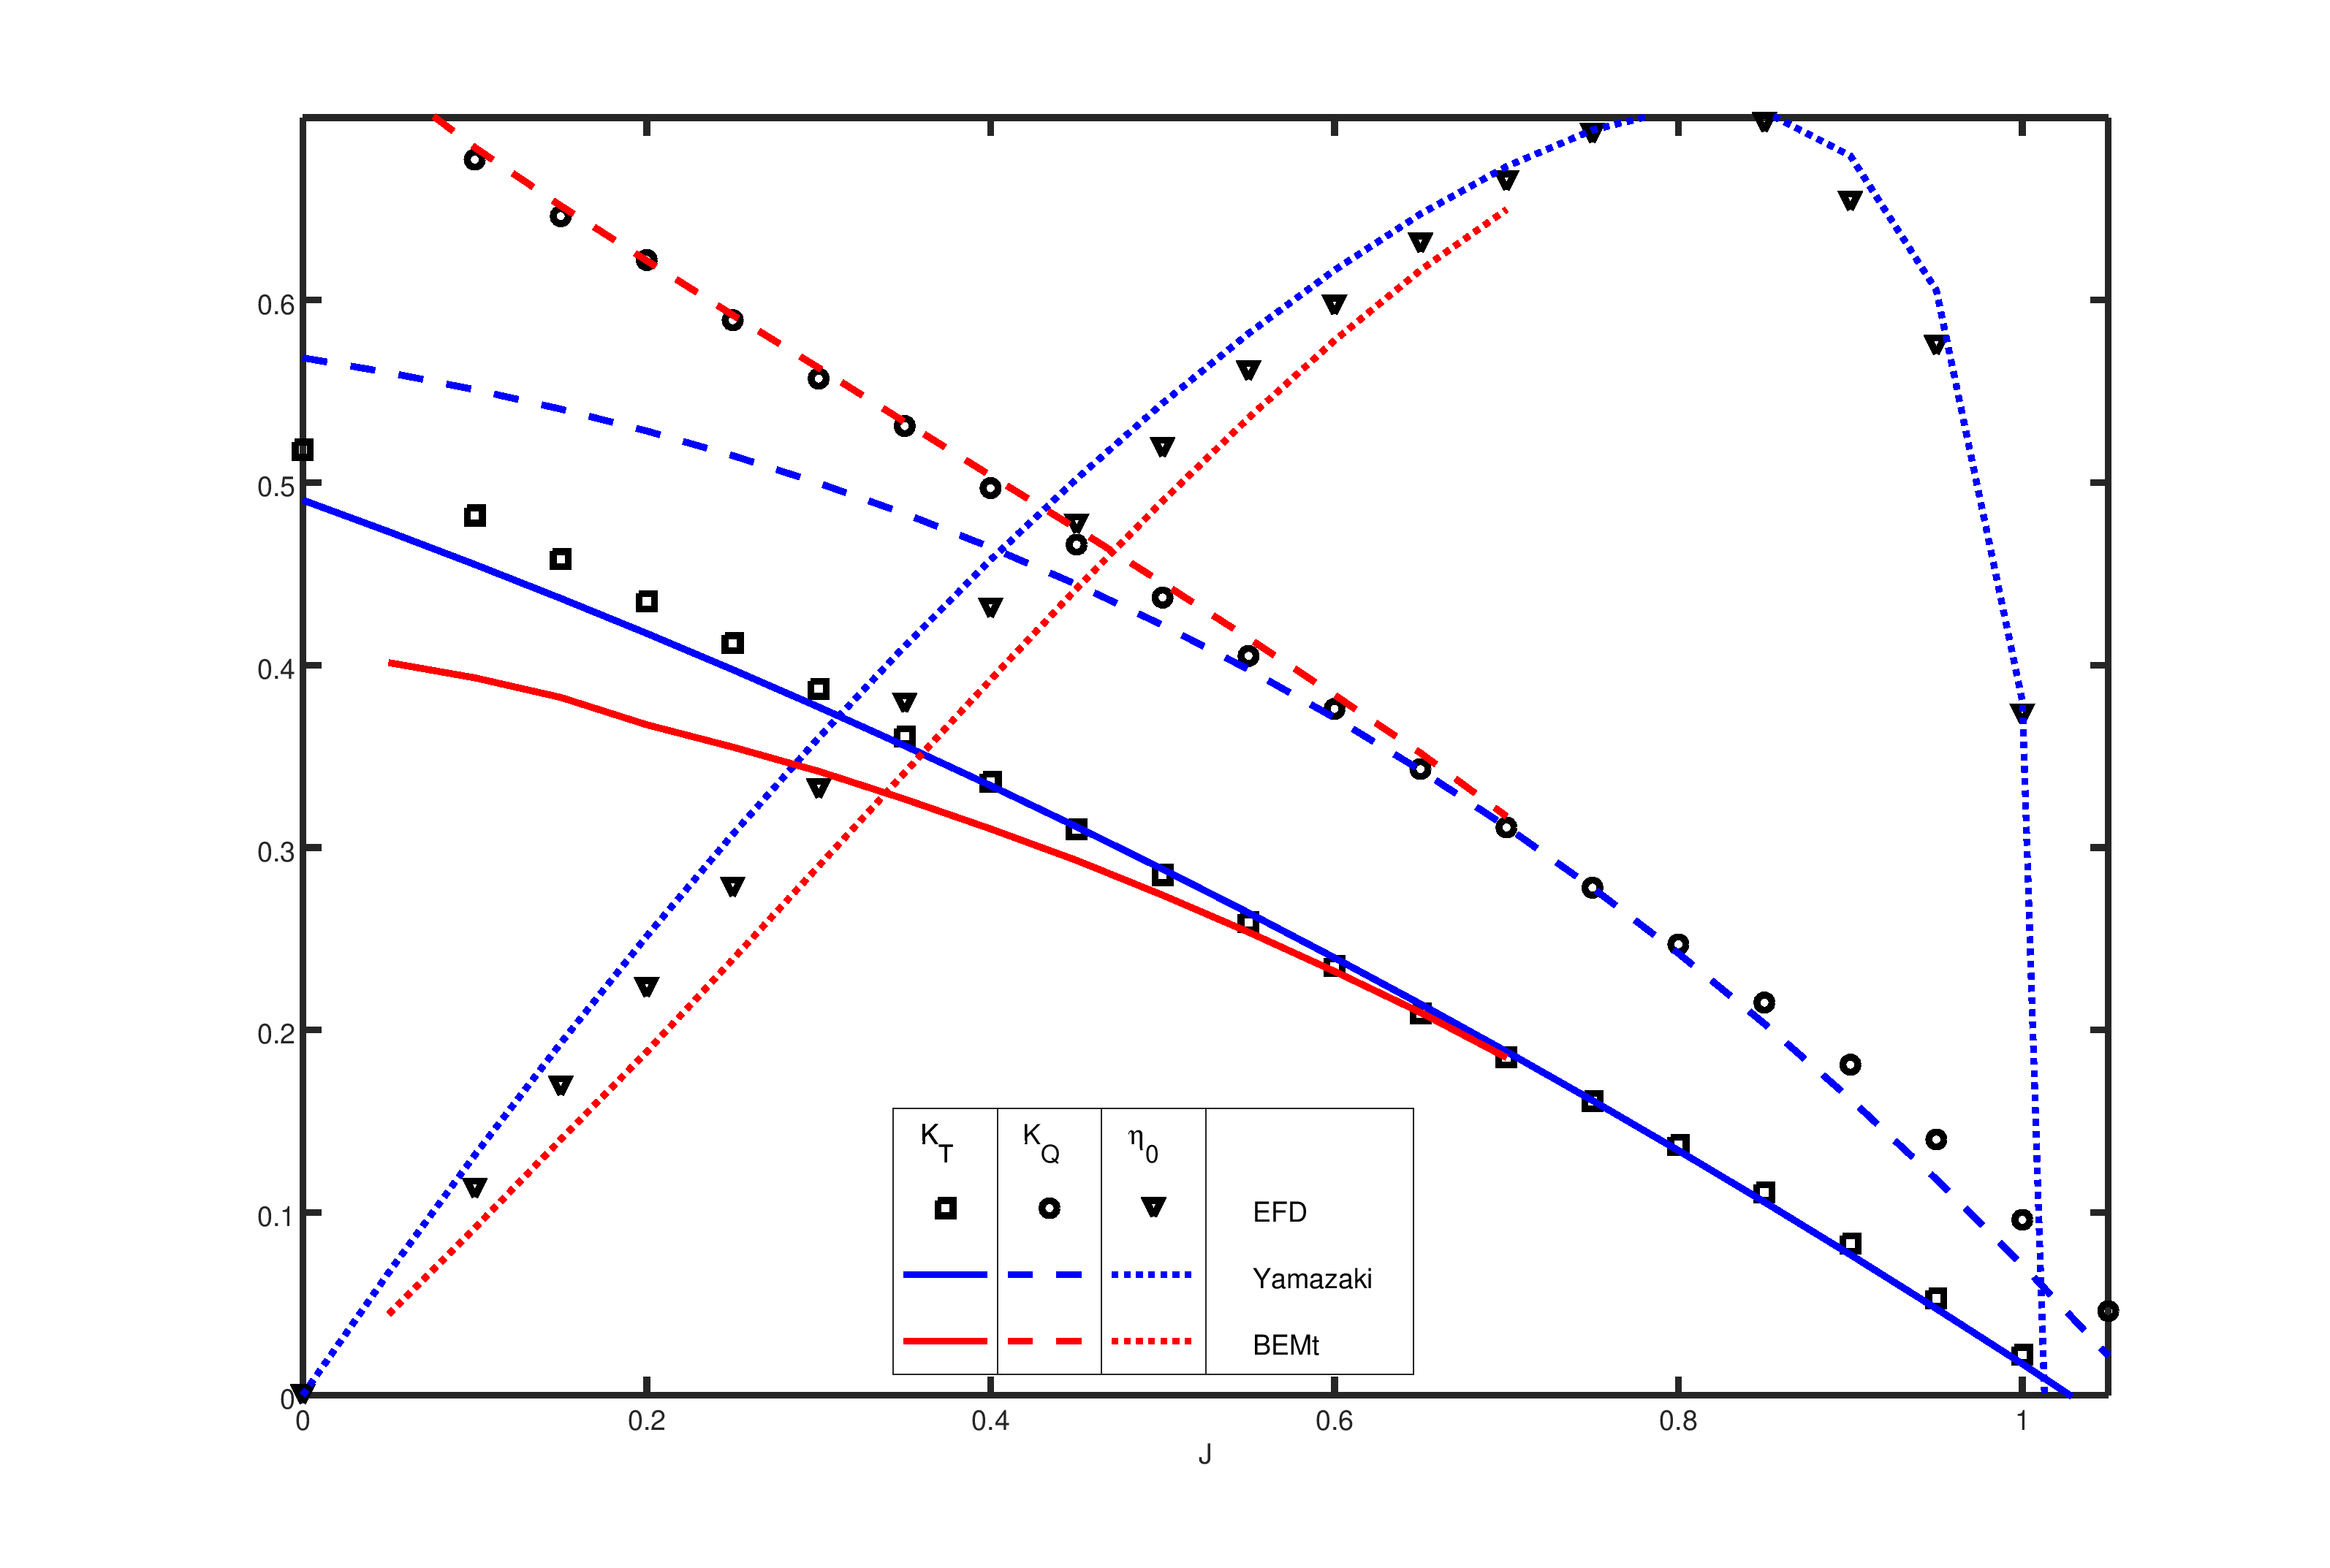
Open water performance of the KCS propeller predicted by SHORTCUt models. Compared to experimental data.
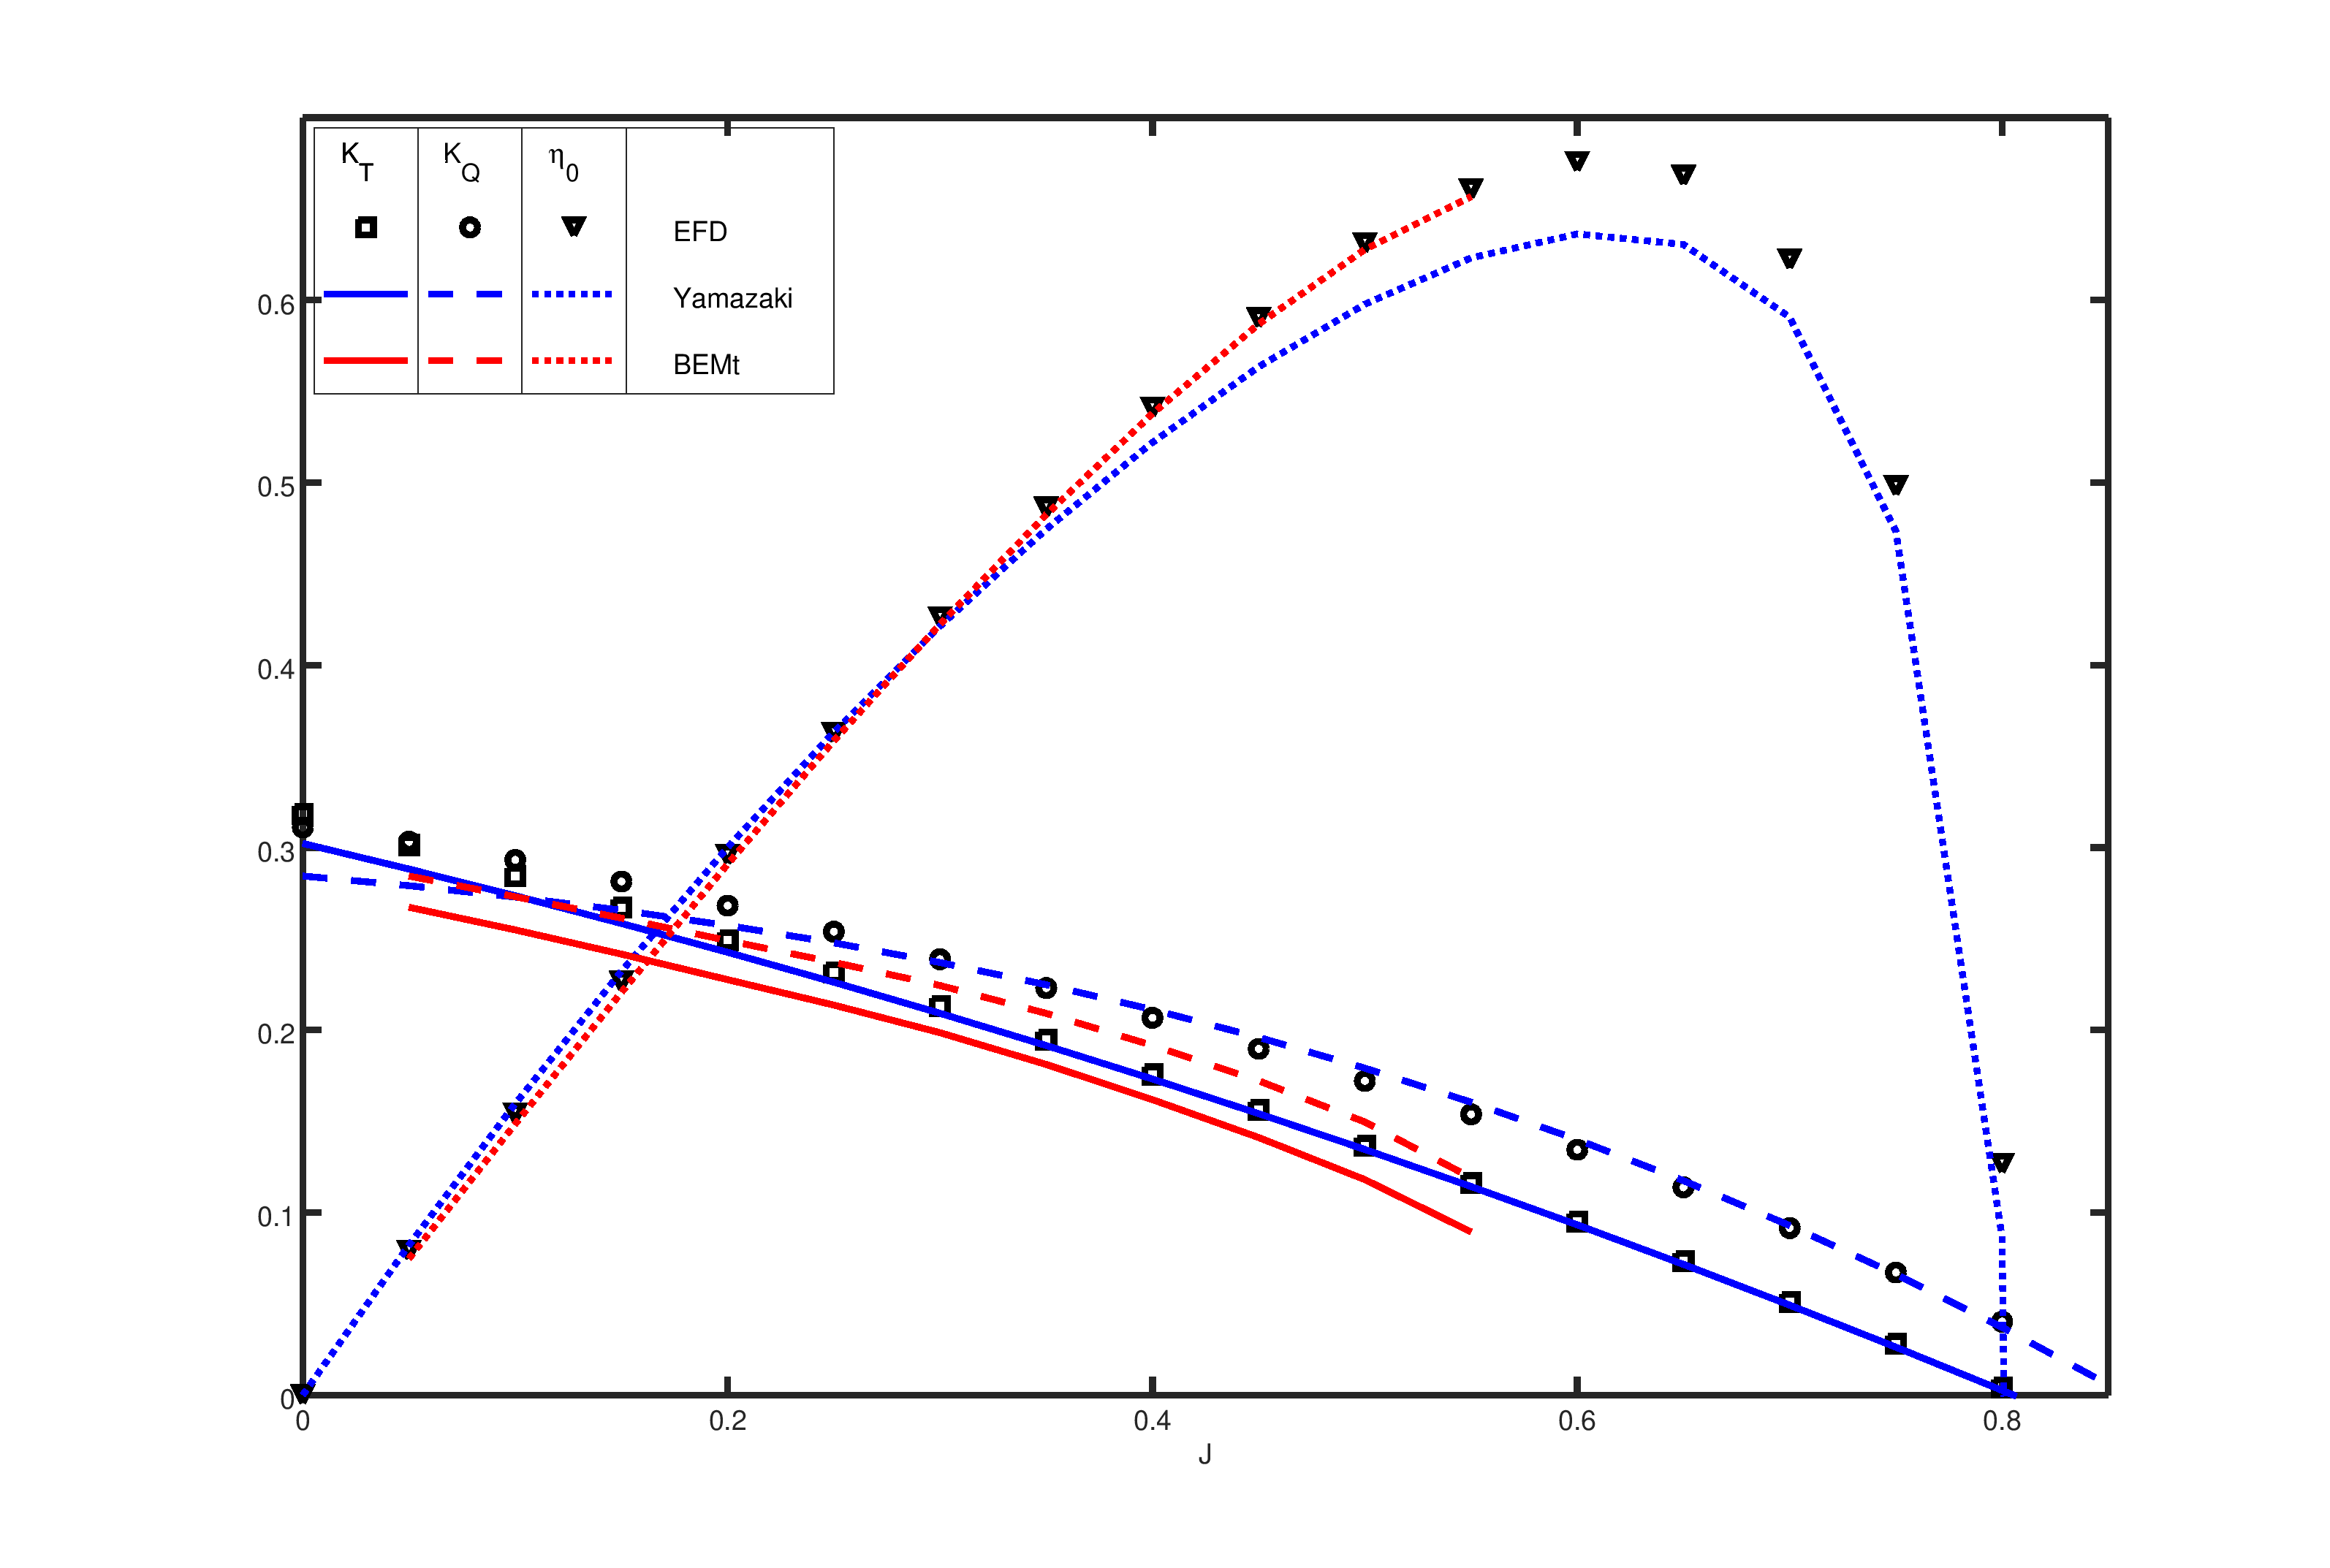
Open water performance of the KVLCC2 propeller predicted by SHORTCUt models. Compared to experimental data.
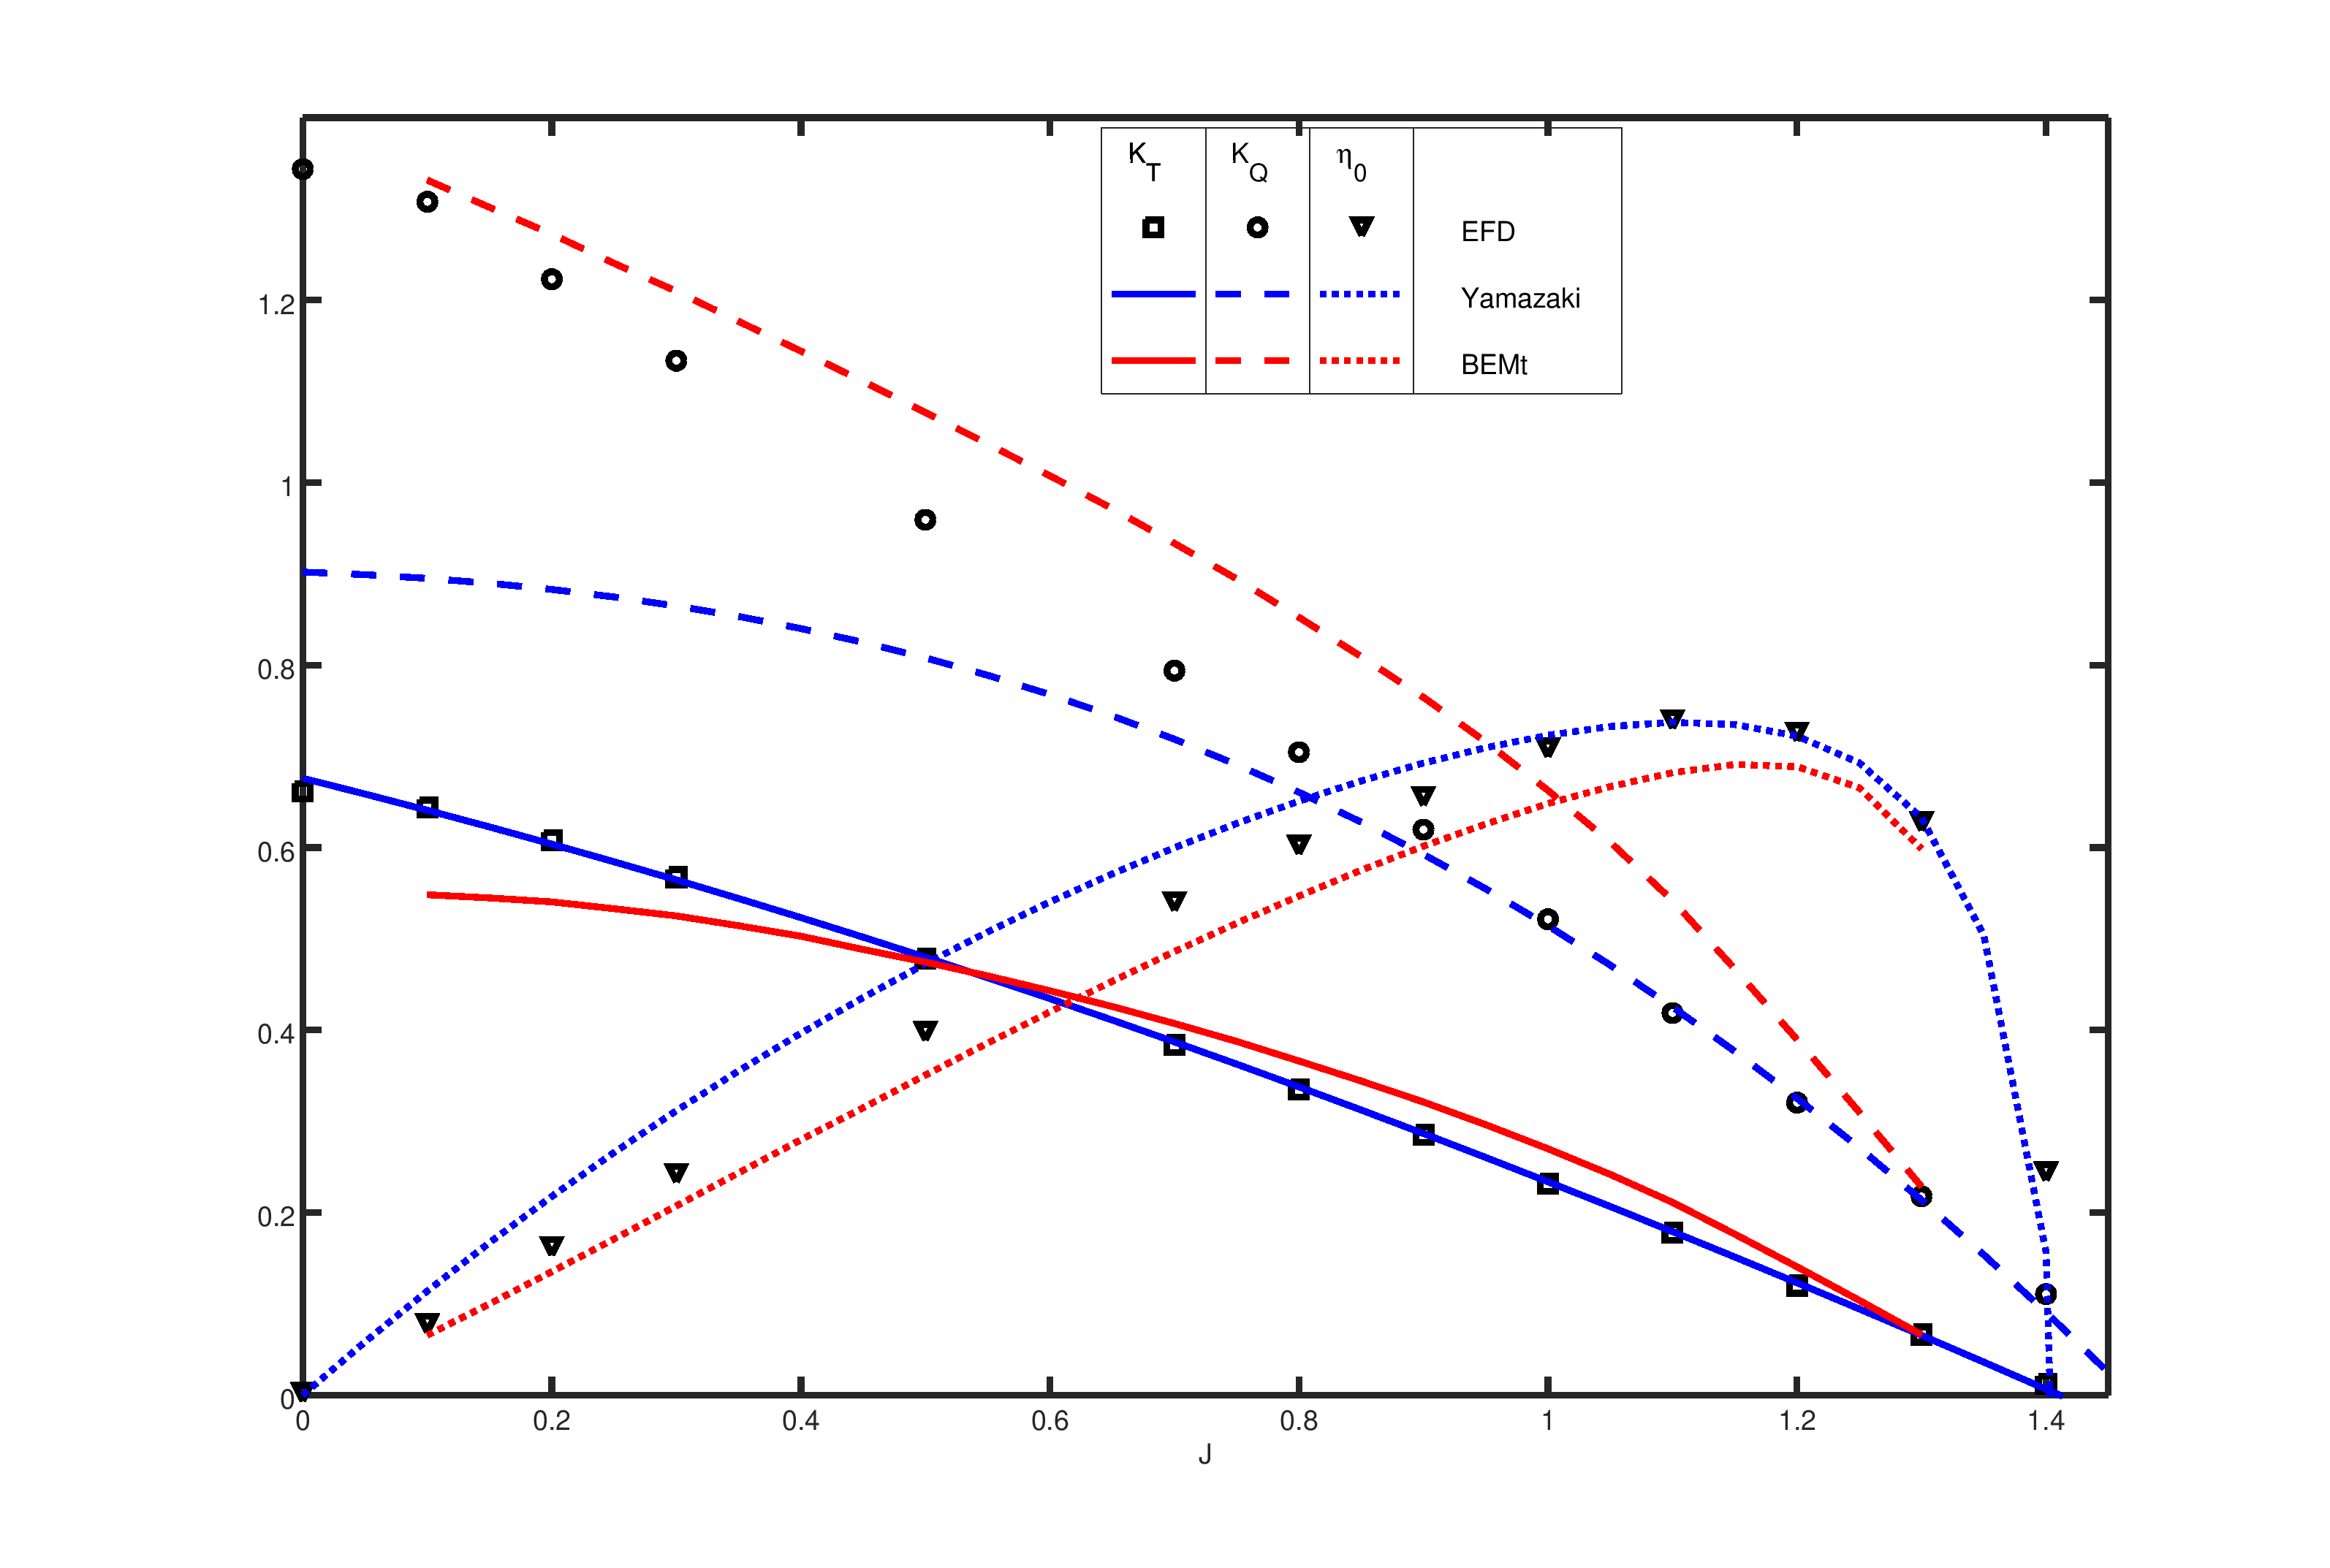
Open water performance of the DTMB5415 propeller predicted by SHORTCUt models. Compared to experimental data.
The JBC is a benchmark case for determining the flow around a modern bulk carrier with a complex stern flow. It features an Energy Saving Device (ESD) in the form of a duct in front of the propeller; improving the wake fraction. Experimental data regarding the self propulsion performance of the JBC (with and without the ESD) was released as part of the Tokyo 2015 workshop on numerical hydrodynamics. Many leading institutions have submitted calculation results for comparison with this experimental data. These results represent the state of the art of marine CFD and were recently summarized and discussed in detail by Hino et.al. Eds. (2020).
Here, the experimental and current state of the art computational results, published by Hino et.al. Eds. (2020), are compared with results obtained with SHORTCUt and the self propulsion framework. This calculation is identical to the one obtained with the default SHORTCUt settings (in v. 0.12), i.e. the default settingsDict generated by the newShip-command.
| Property | Model Scale | Full Scale |
|---|---|---|
| Lpp | 7m | 280m |
| Fn(Lpp) | 0.142 (1.179 m/s) | 0.142 (14.5 kn) |
| Wetted surface area | 12.2696 m2 | 19633.9 m2 |
| Propeller | ||
| Diameter | 0.203m | 8m |
| No. blades | 5 | 5 |
| Rotation direction | Clockwise | Clockwise |
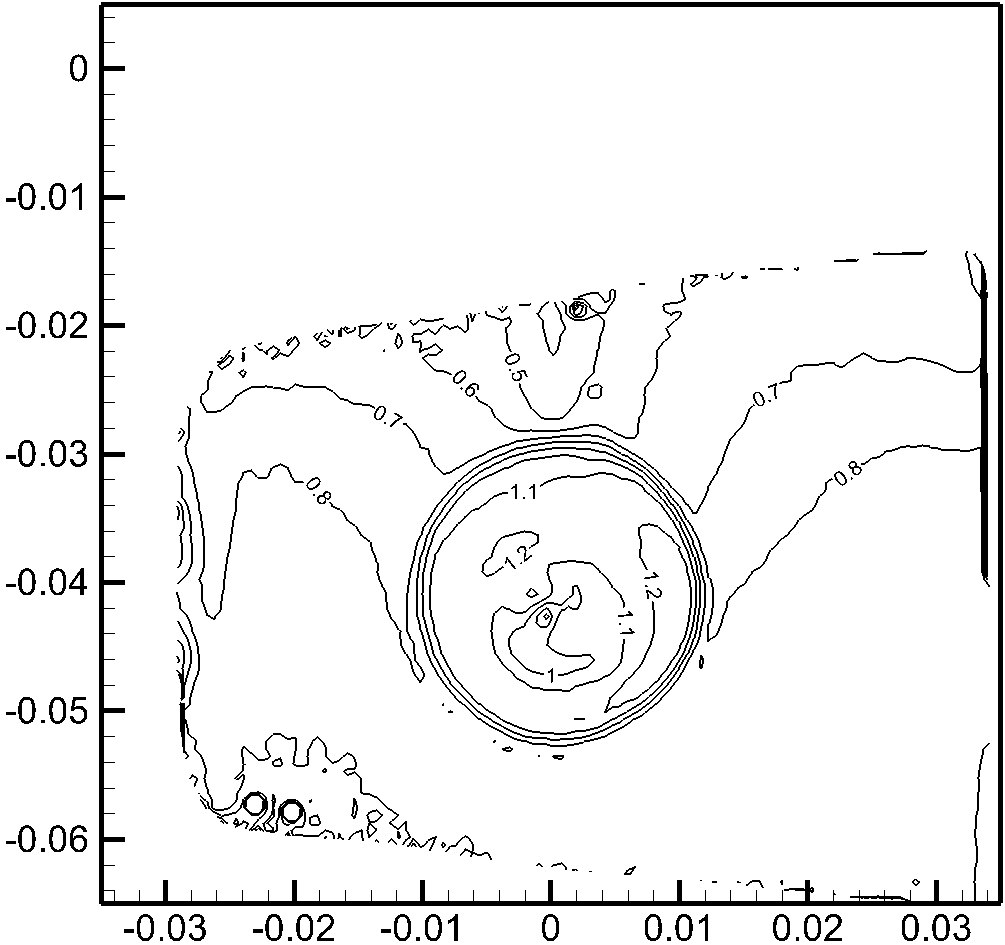
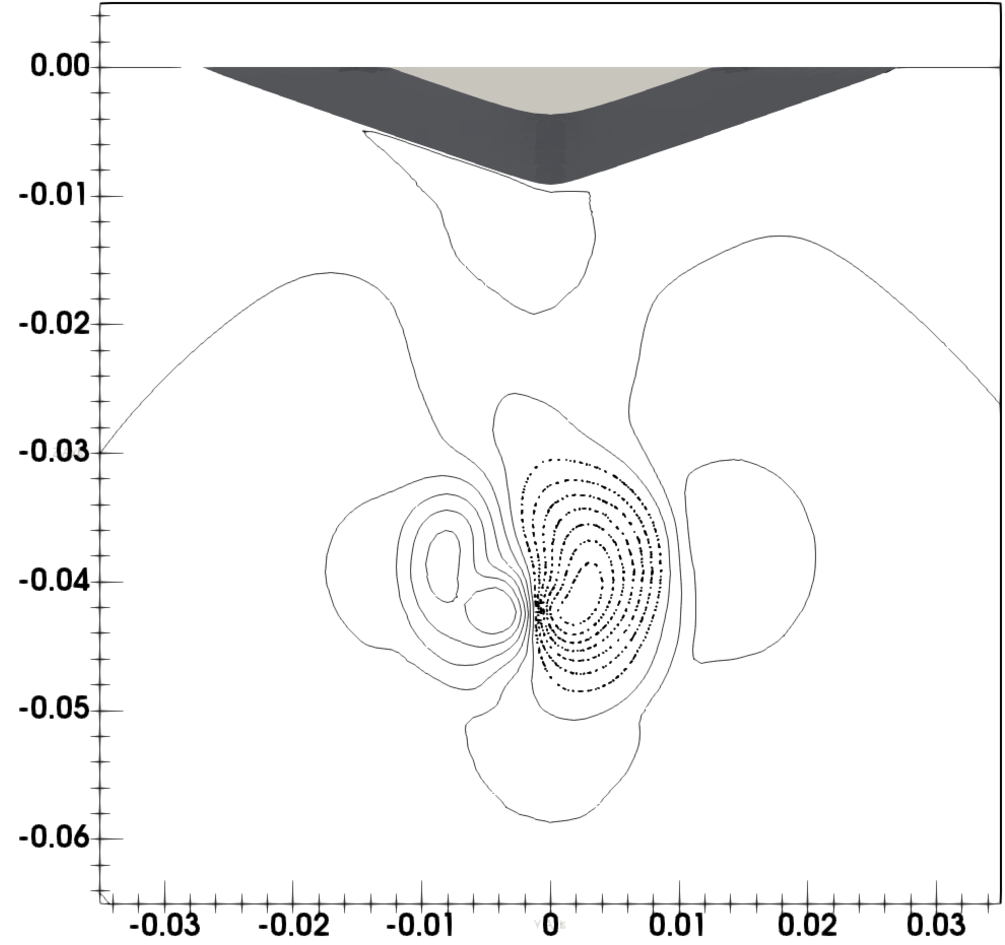
Results are presented here in the form of the computed wake fraction 1-w and powering requirement Ps. The predicted reduction of 1-w and Ps are also presented. The wake fraction is taken directly from the SHORTCUt log-file for each case without any further processing. In addition to the integral values, local flow contours are presented at the Aft Perpendicular (AP); behind the propeller. These are compared to experimental results obtained with Particle Image Velocimetry (PIV). These contours were also made available for the Tokyo 2015 workshop.
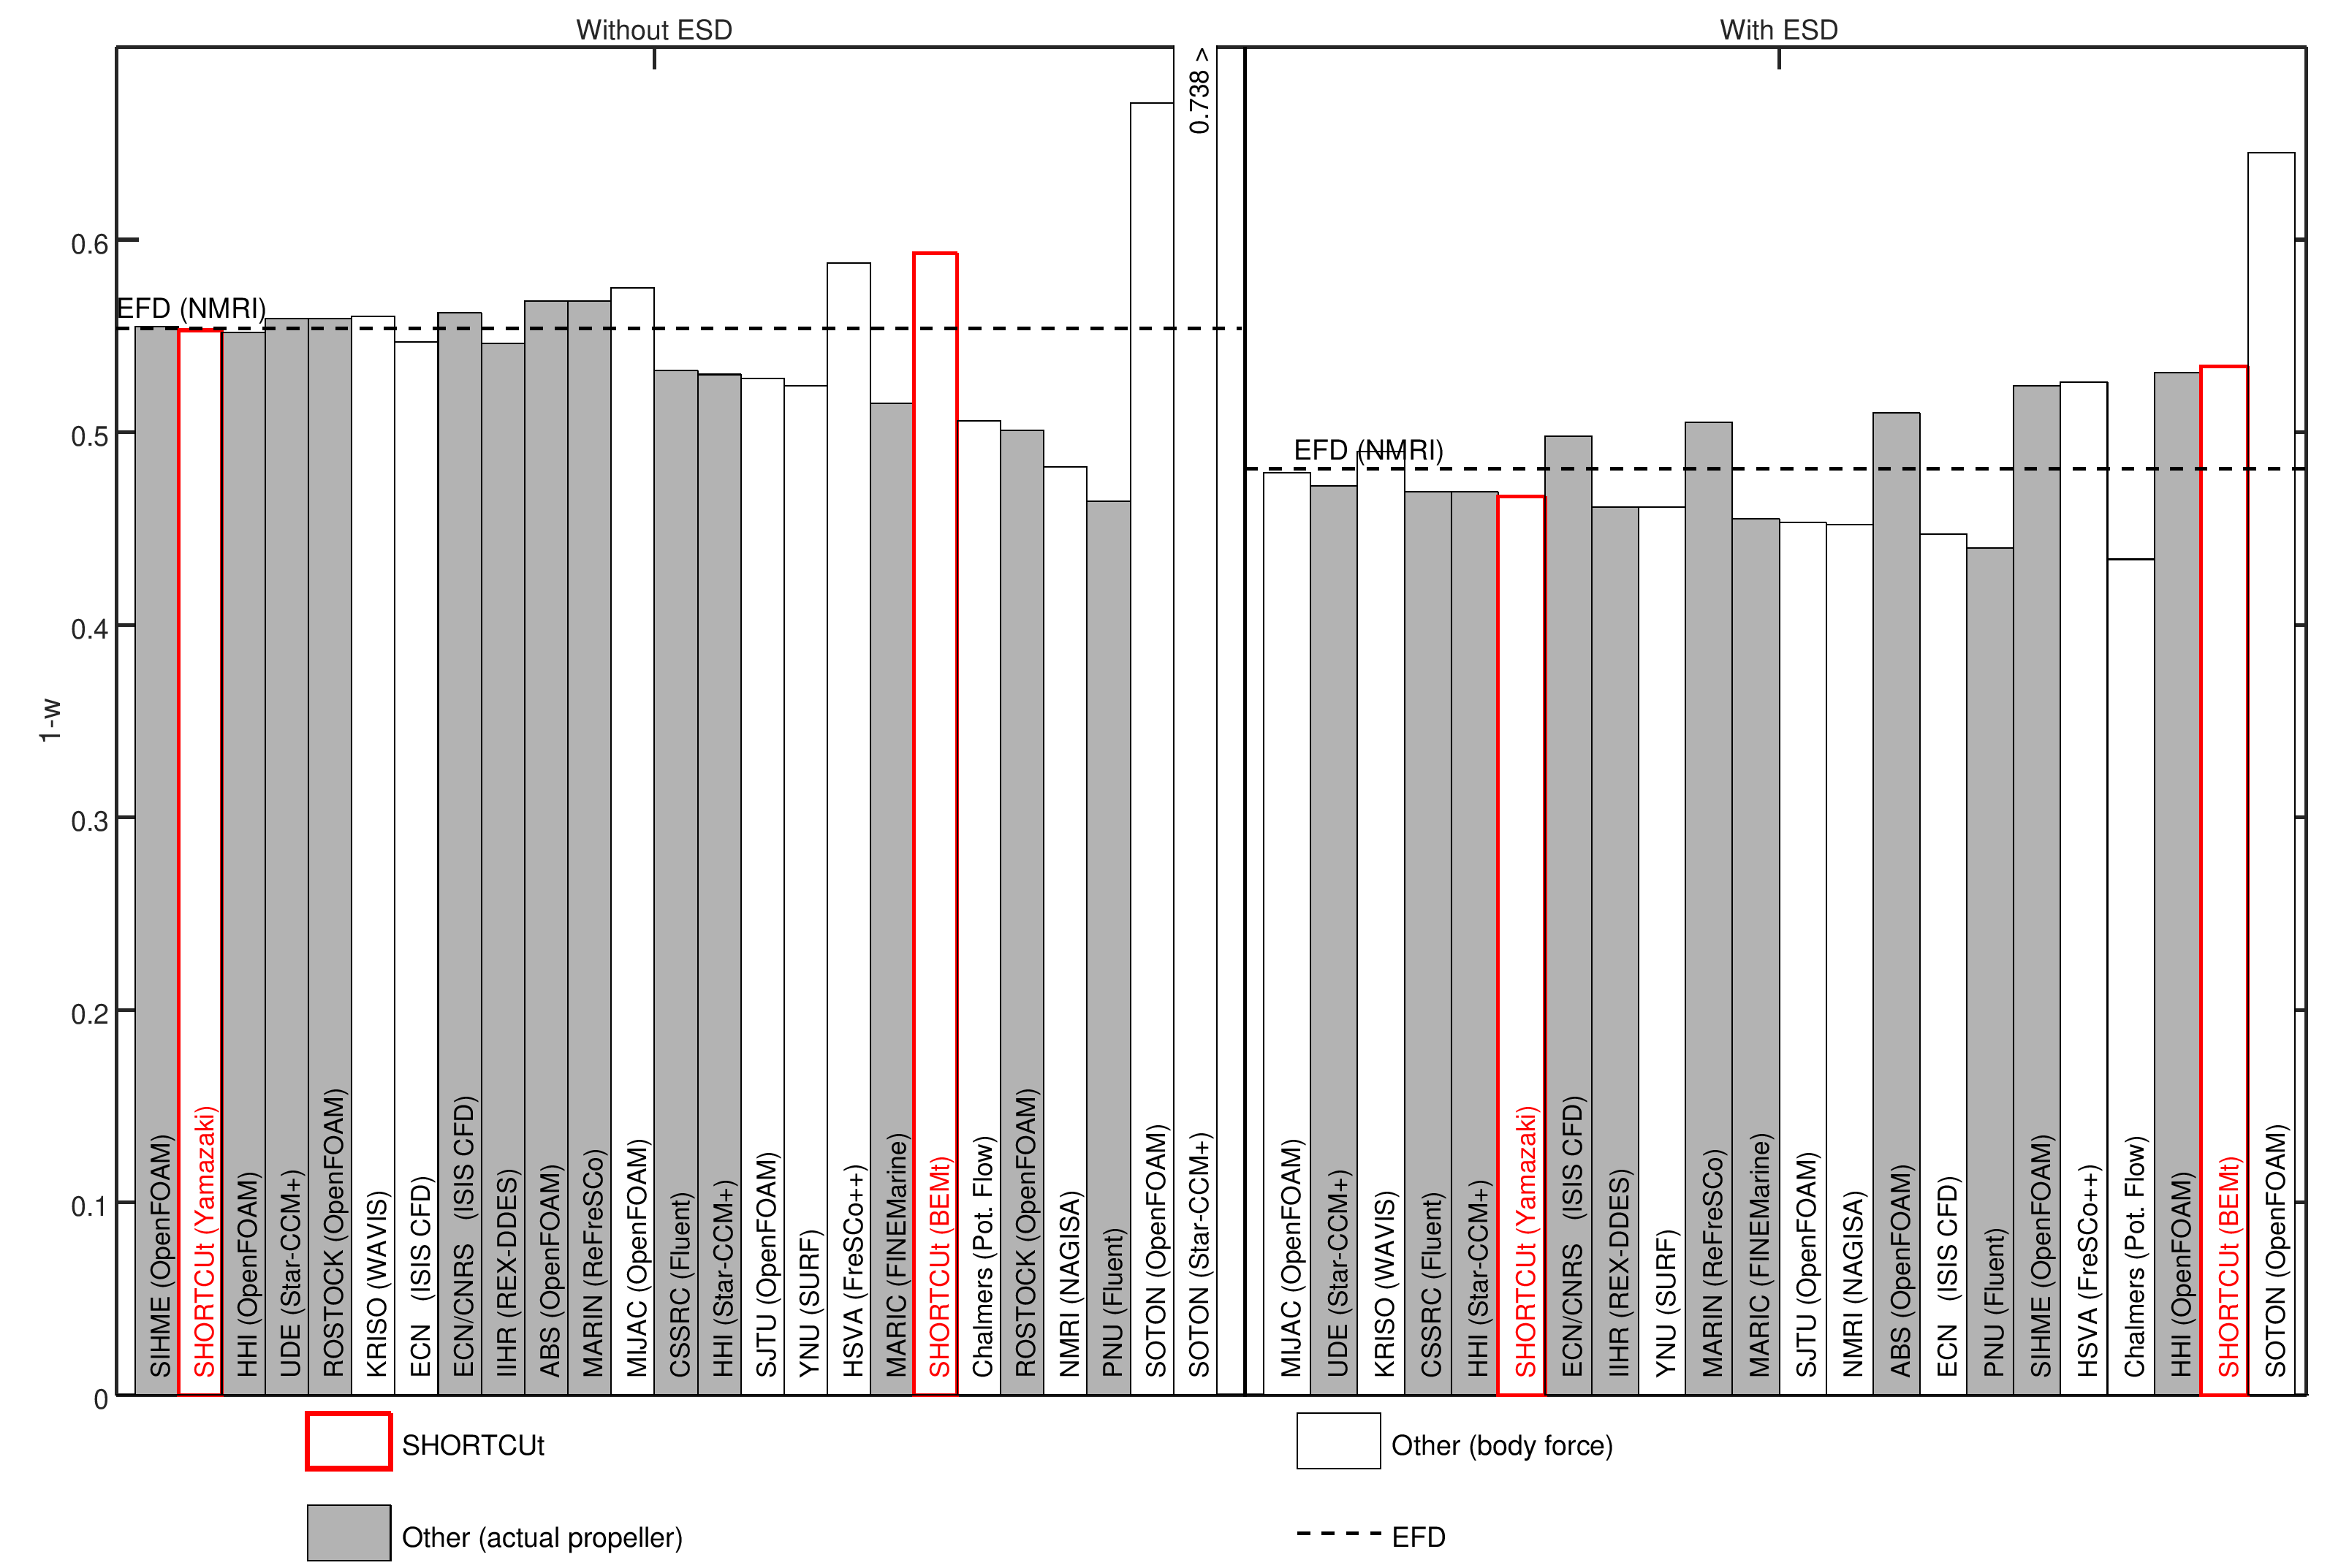
Predicted wake fraction by all submissions to the JBC benchmark case. Compared with SHORTCUt results. Without ESD (left) and With ESD (right). The effect of the duct on the wake fraction can clearly be seen.
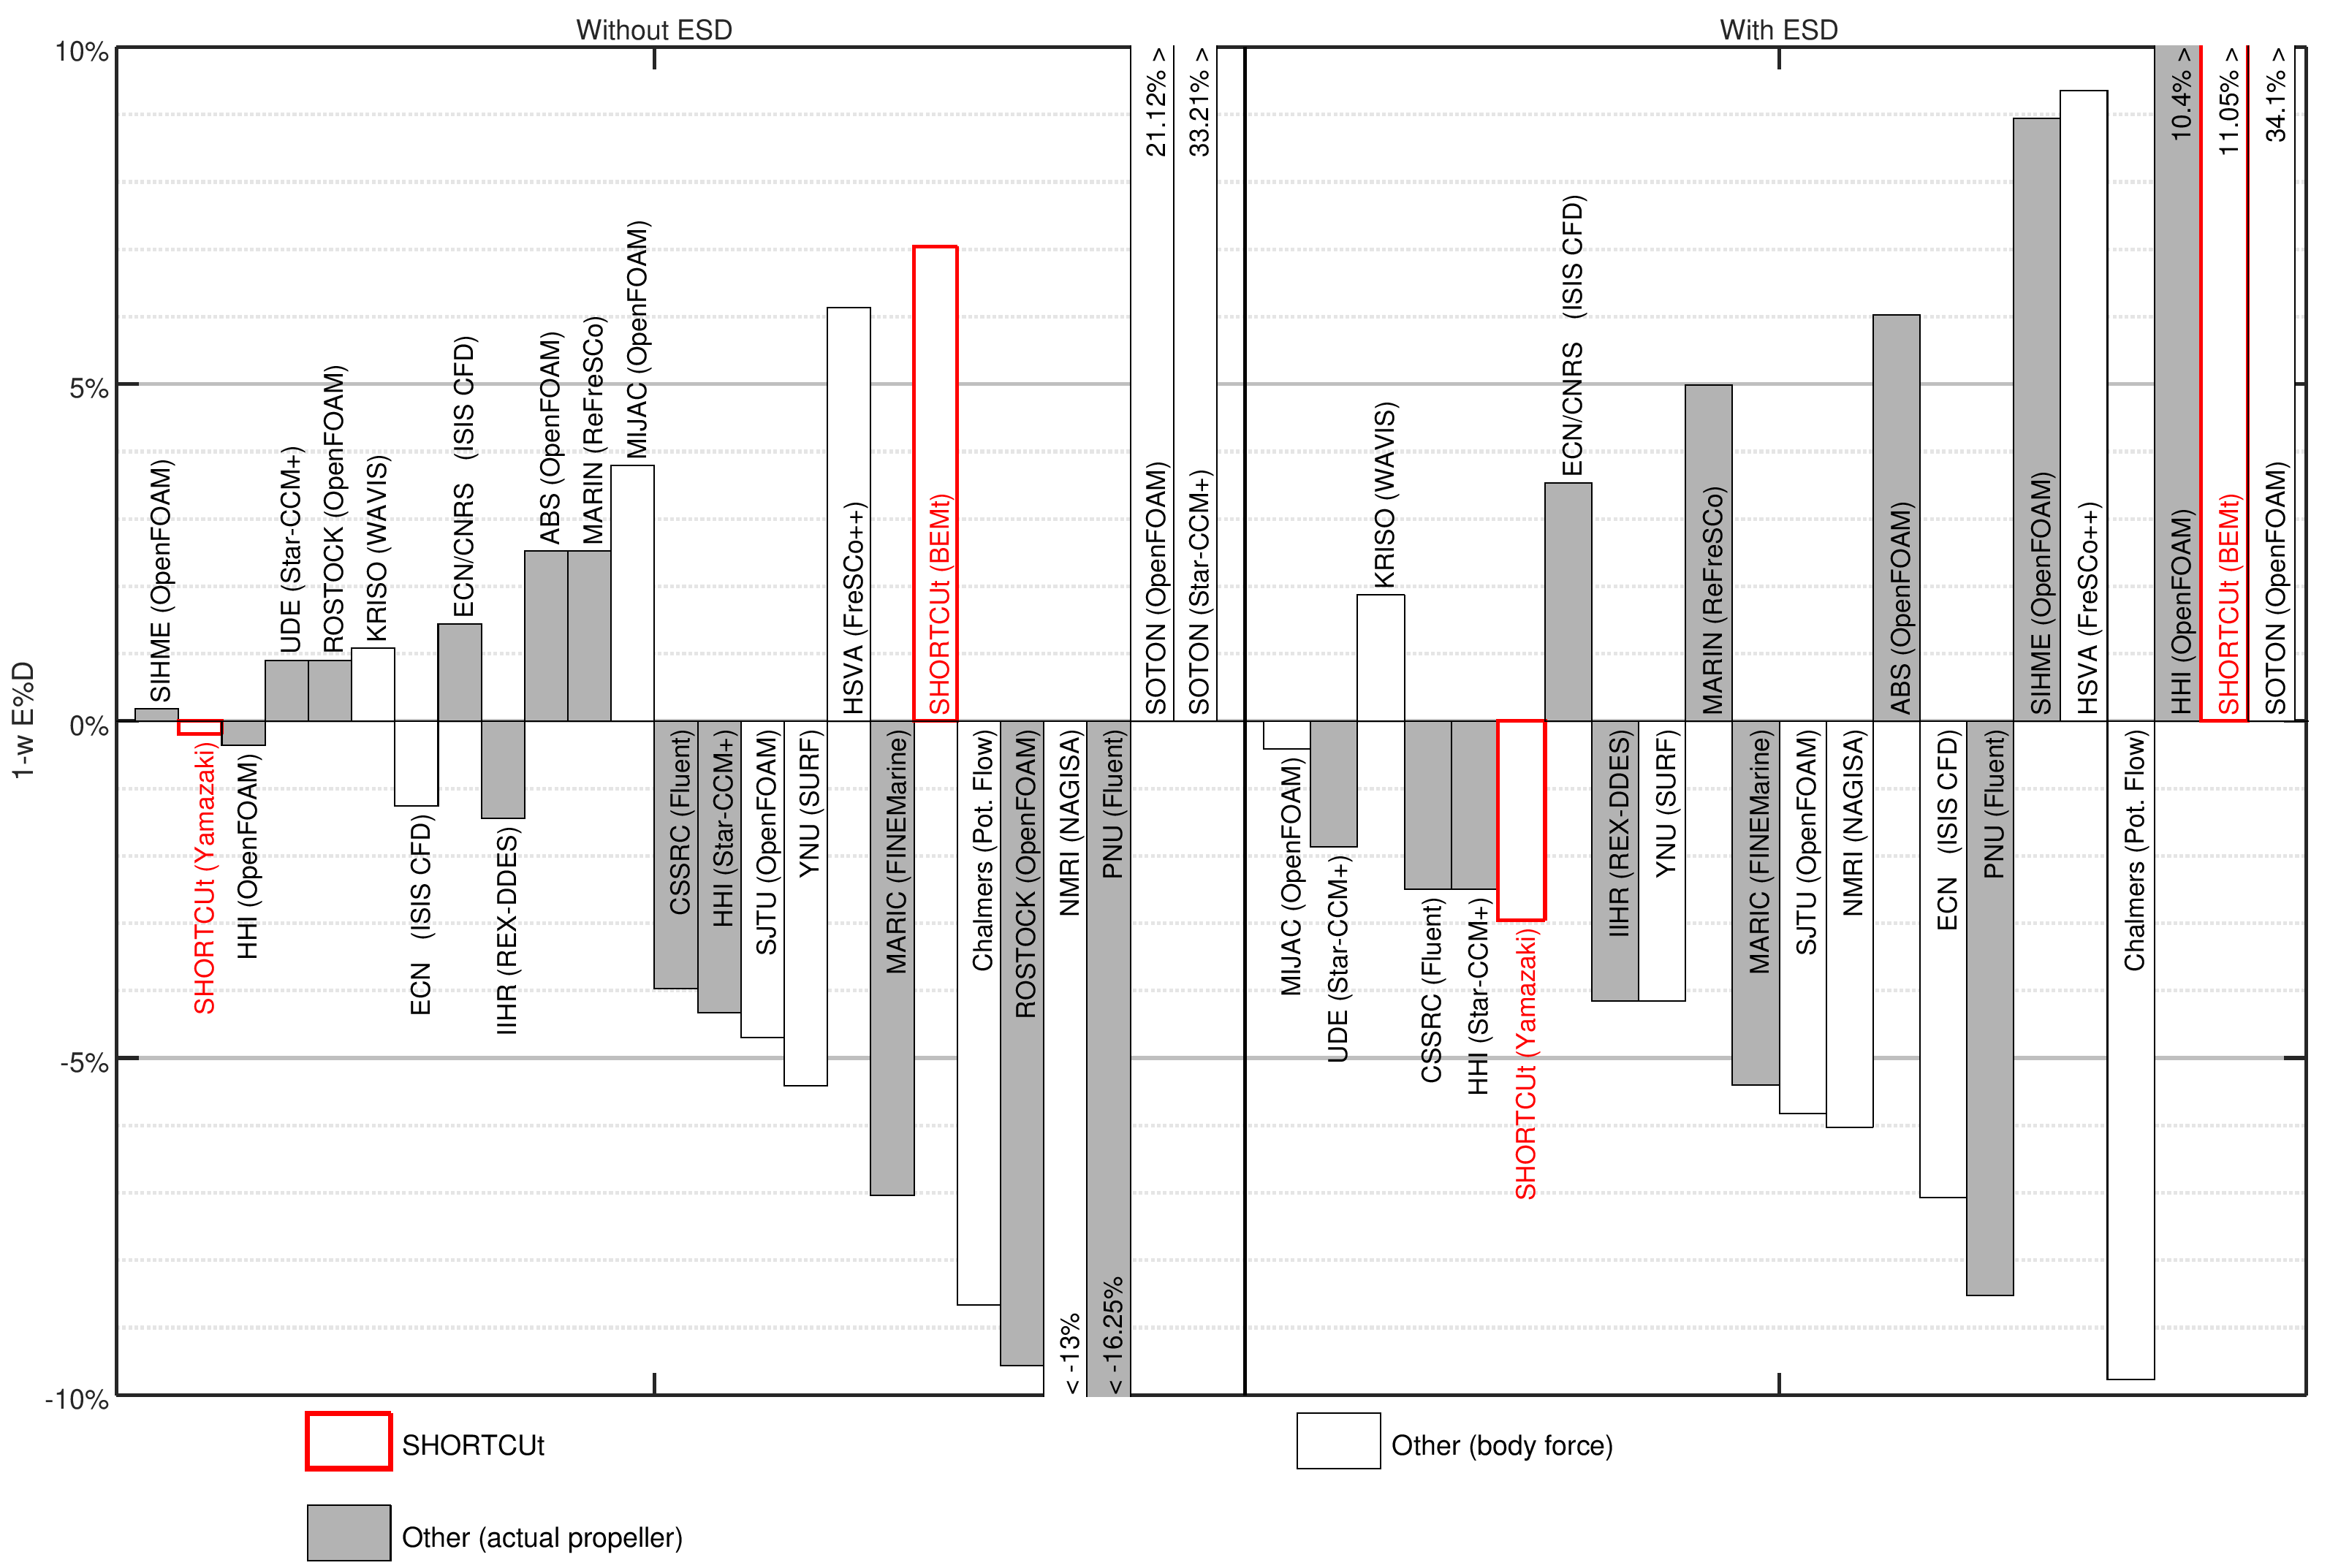
Relative error (compared to experiments) of the predicted wake fraction by all submissions to the JBC benchmark case. Compared with SHORTCUt results. Without ESD (left) and With ESD (right).
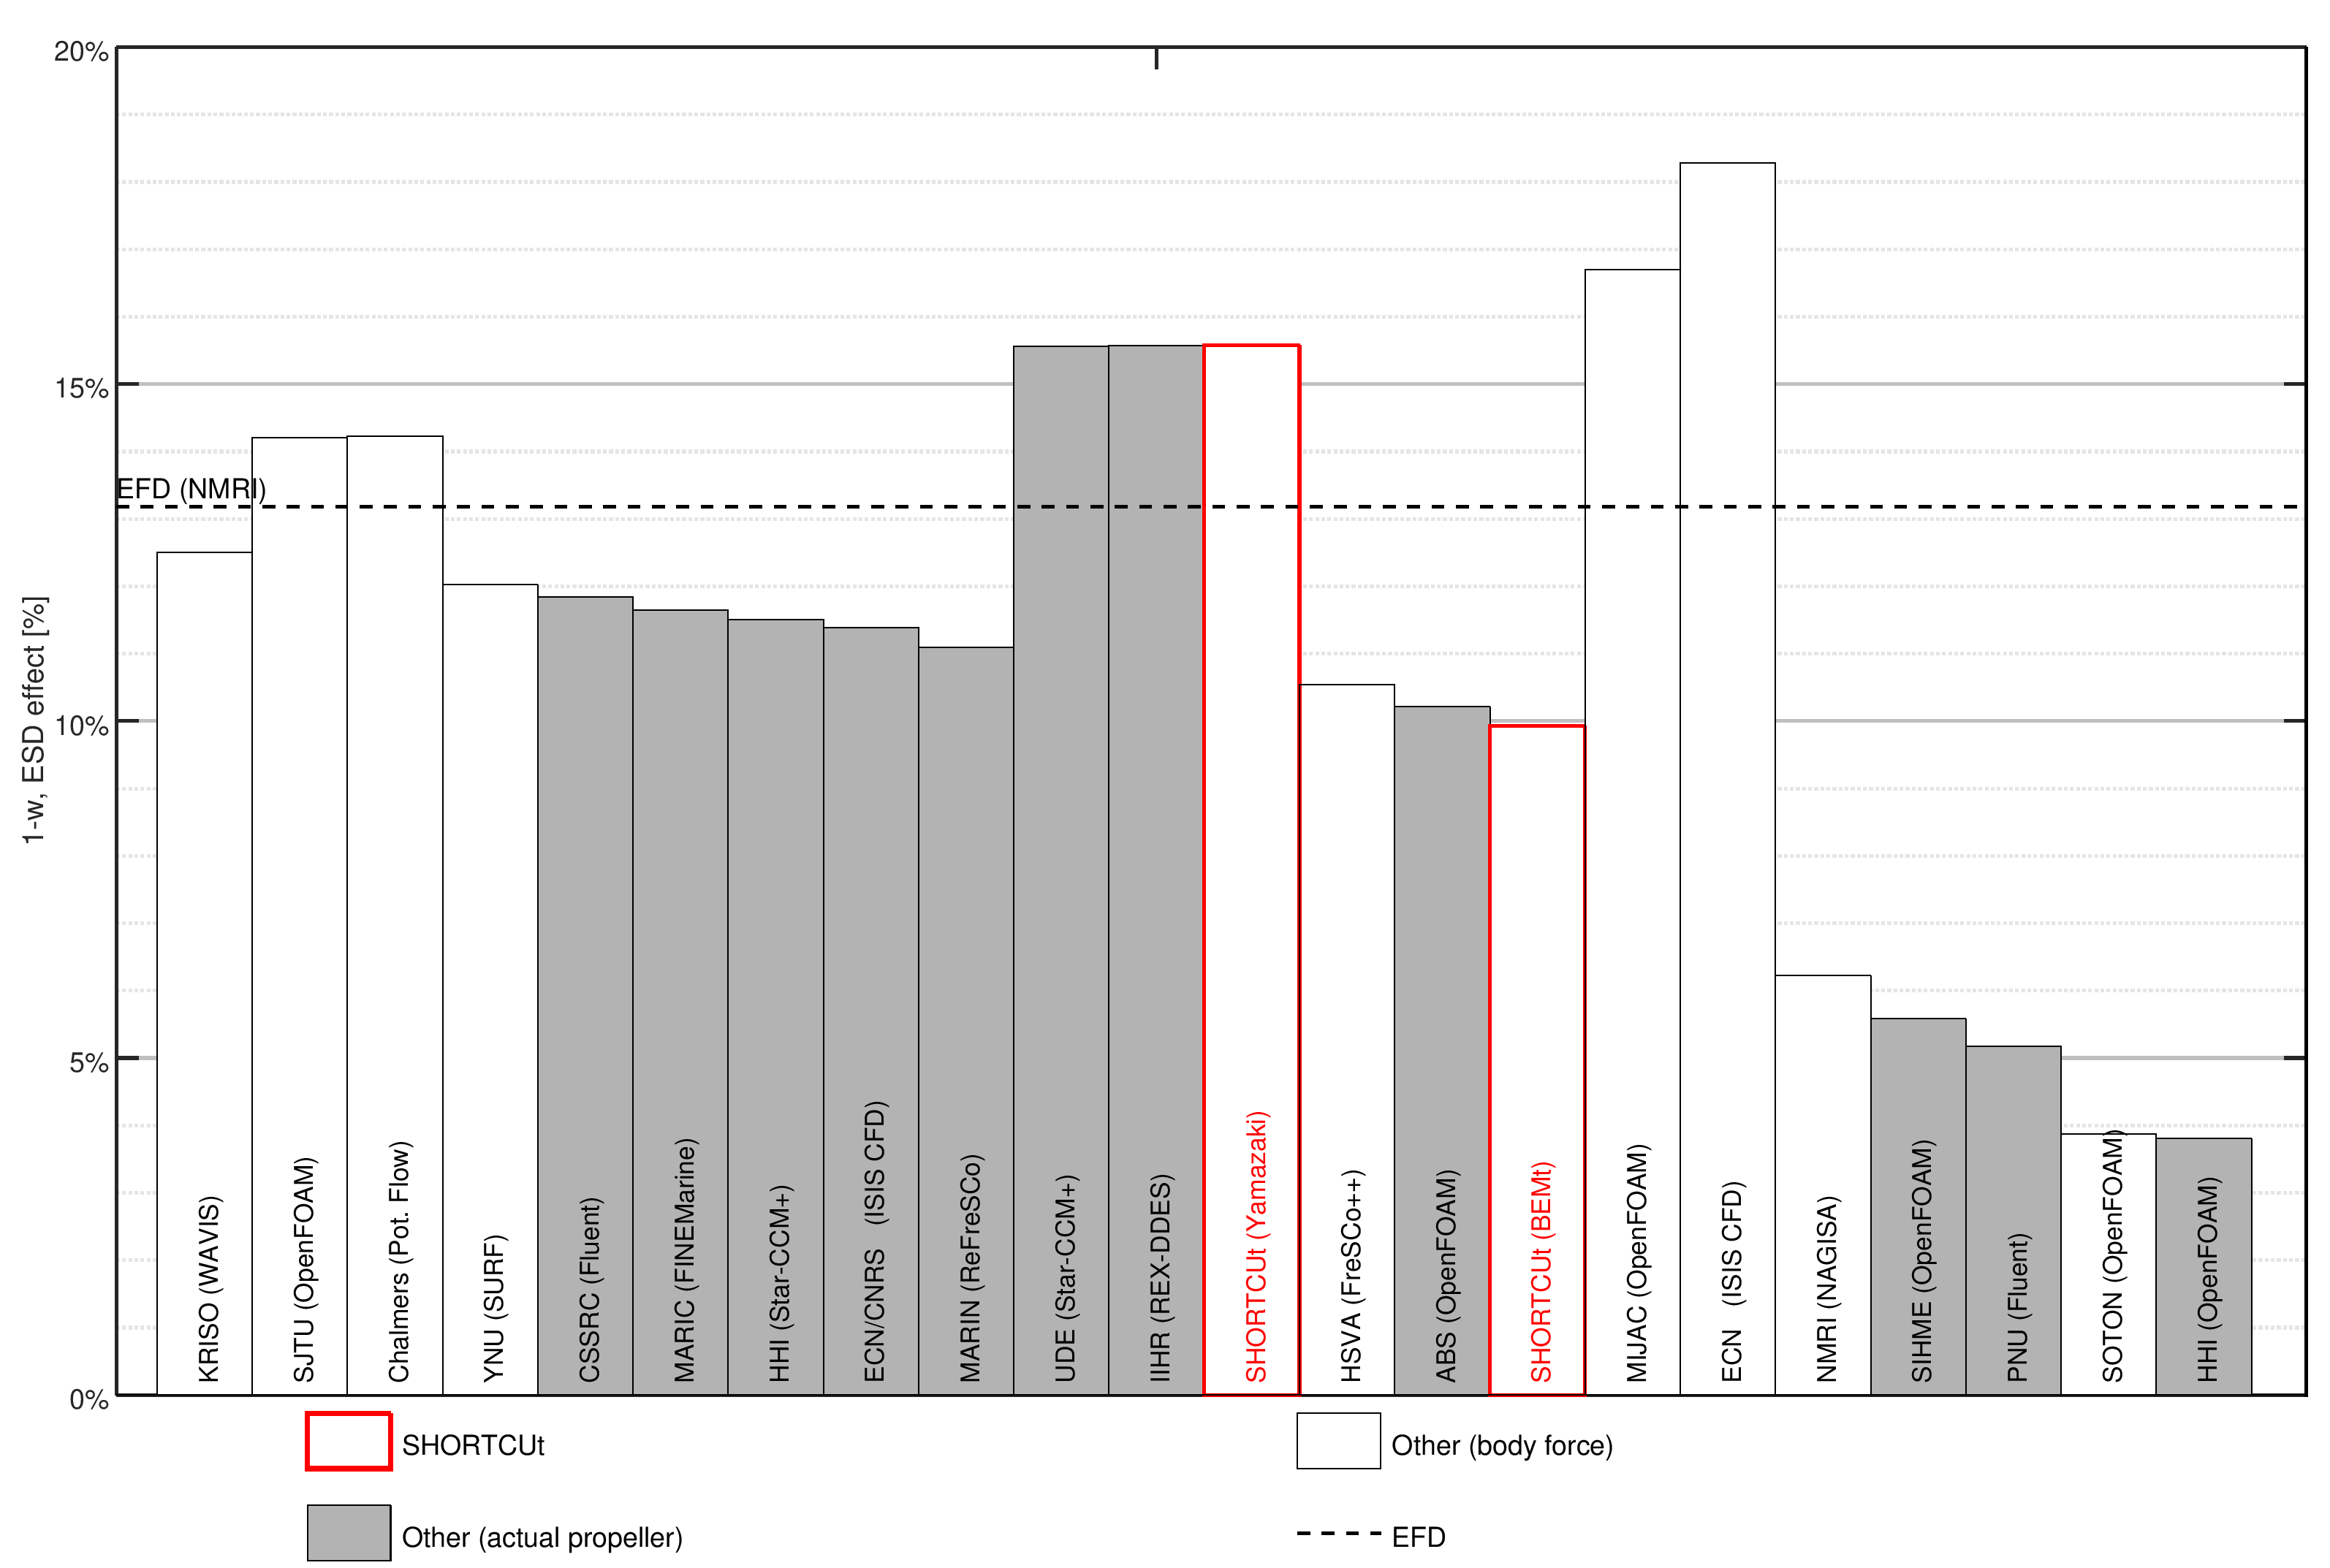
Predicted reduction of wake fraction 1-w due to ESD by all submissions to the JBC benchmark case. Compared with SHORTCUt results.
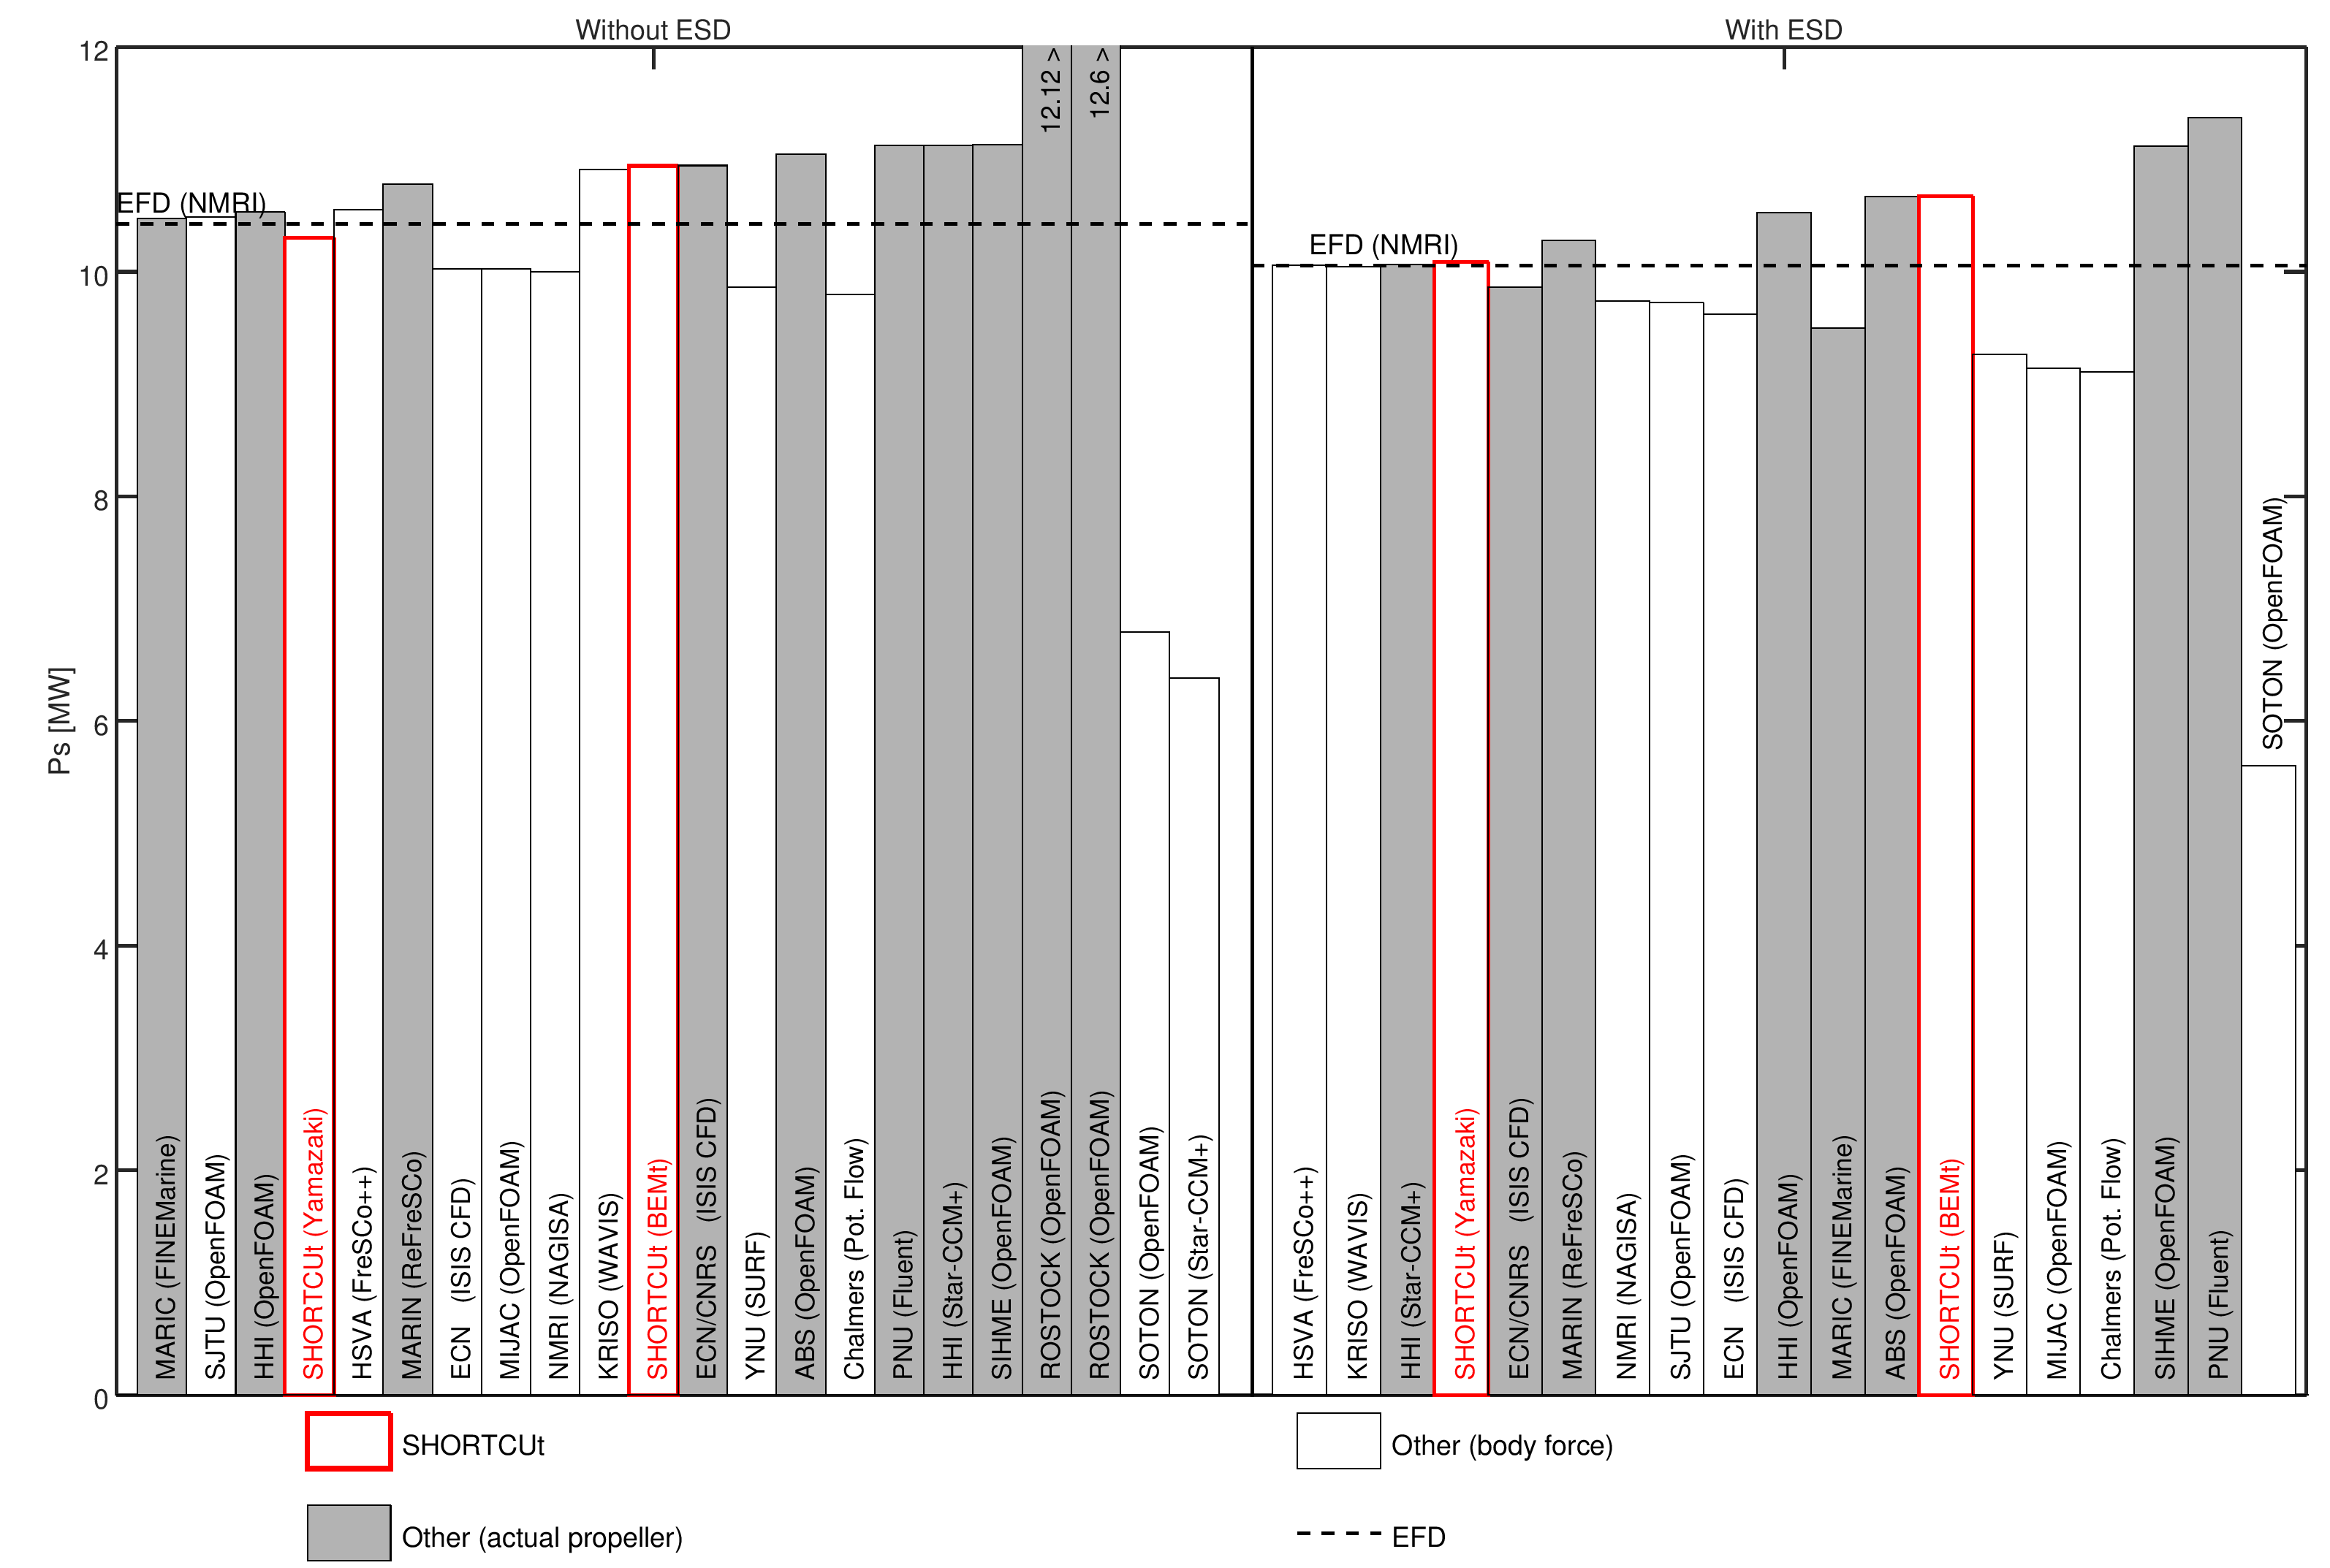
Predicted powering requirement for the full scale ship by all submissions to the JBC benchmark case. Compared with SHORTCUt results. Without ESD (left) and With ESD (right).
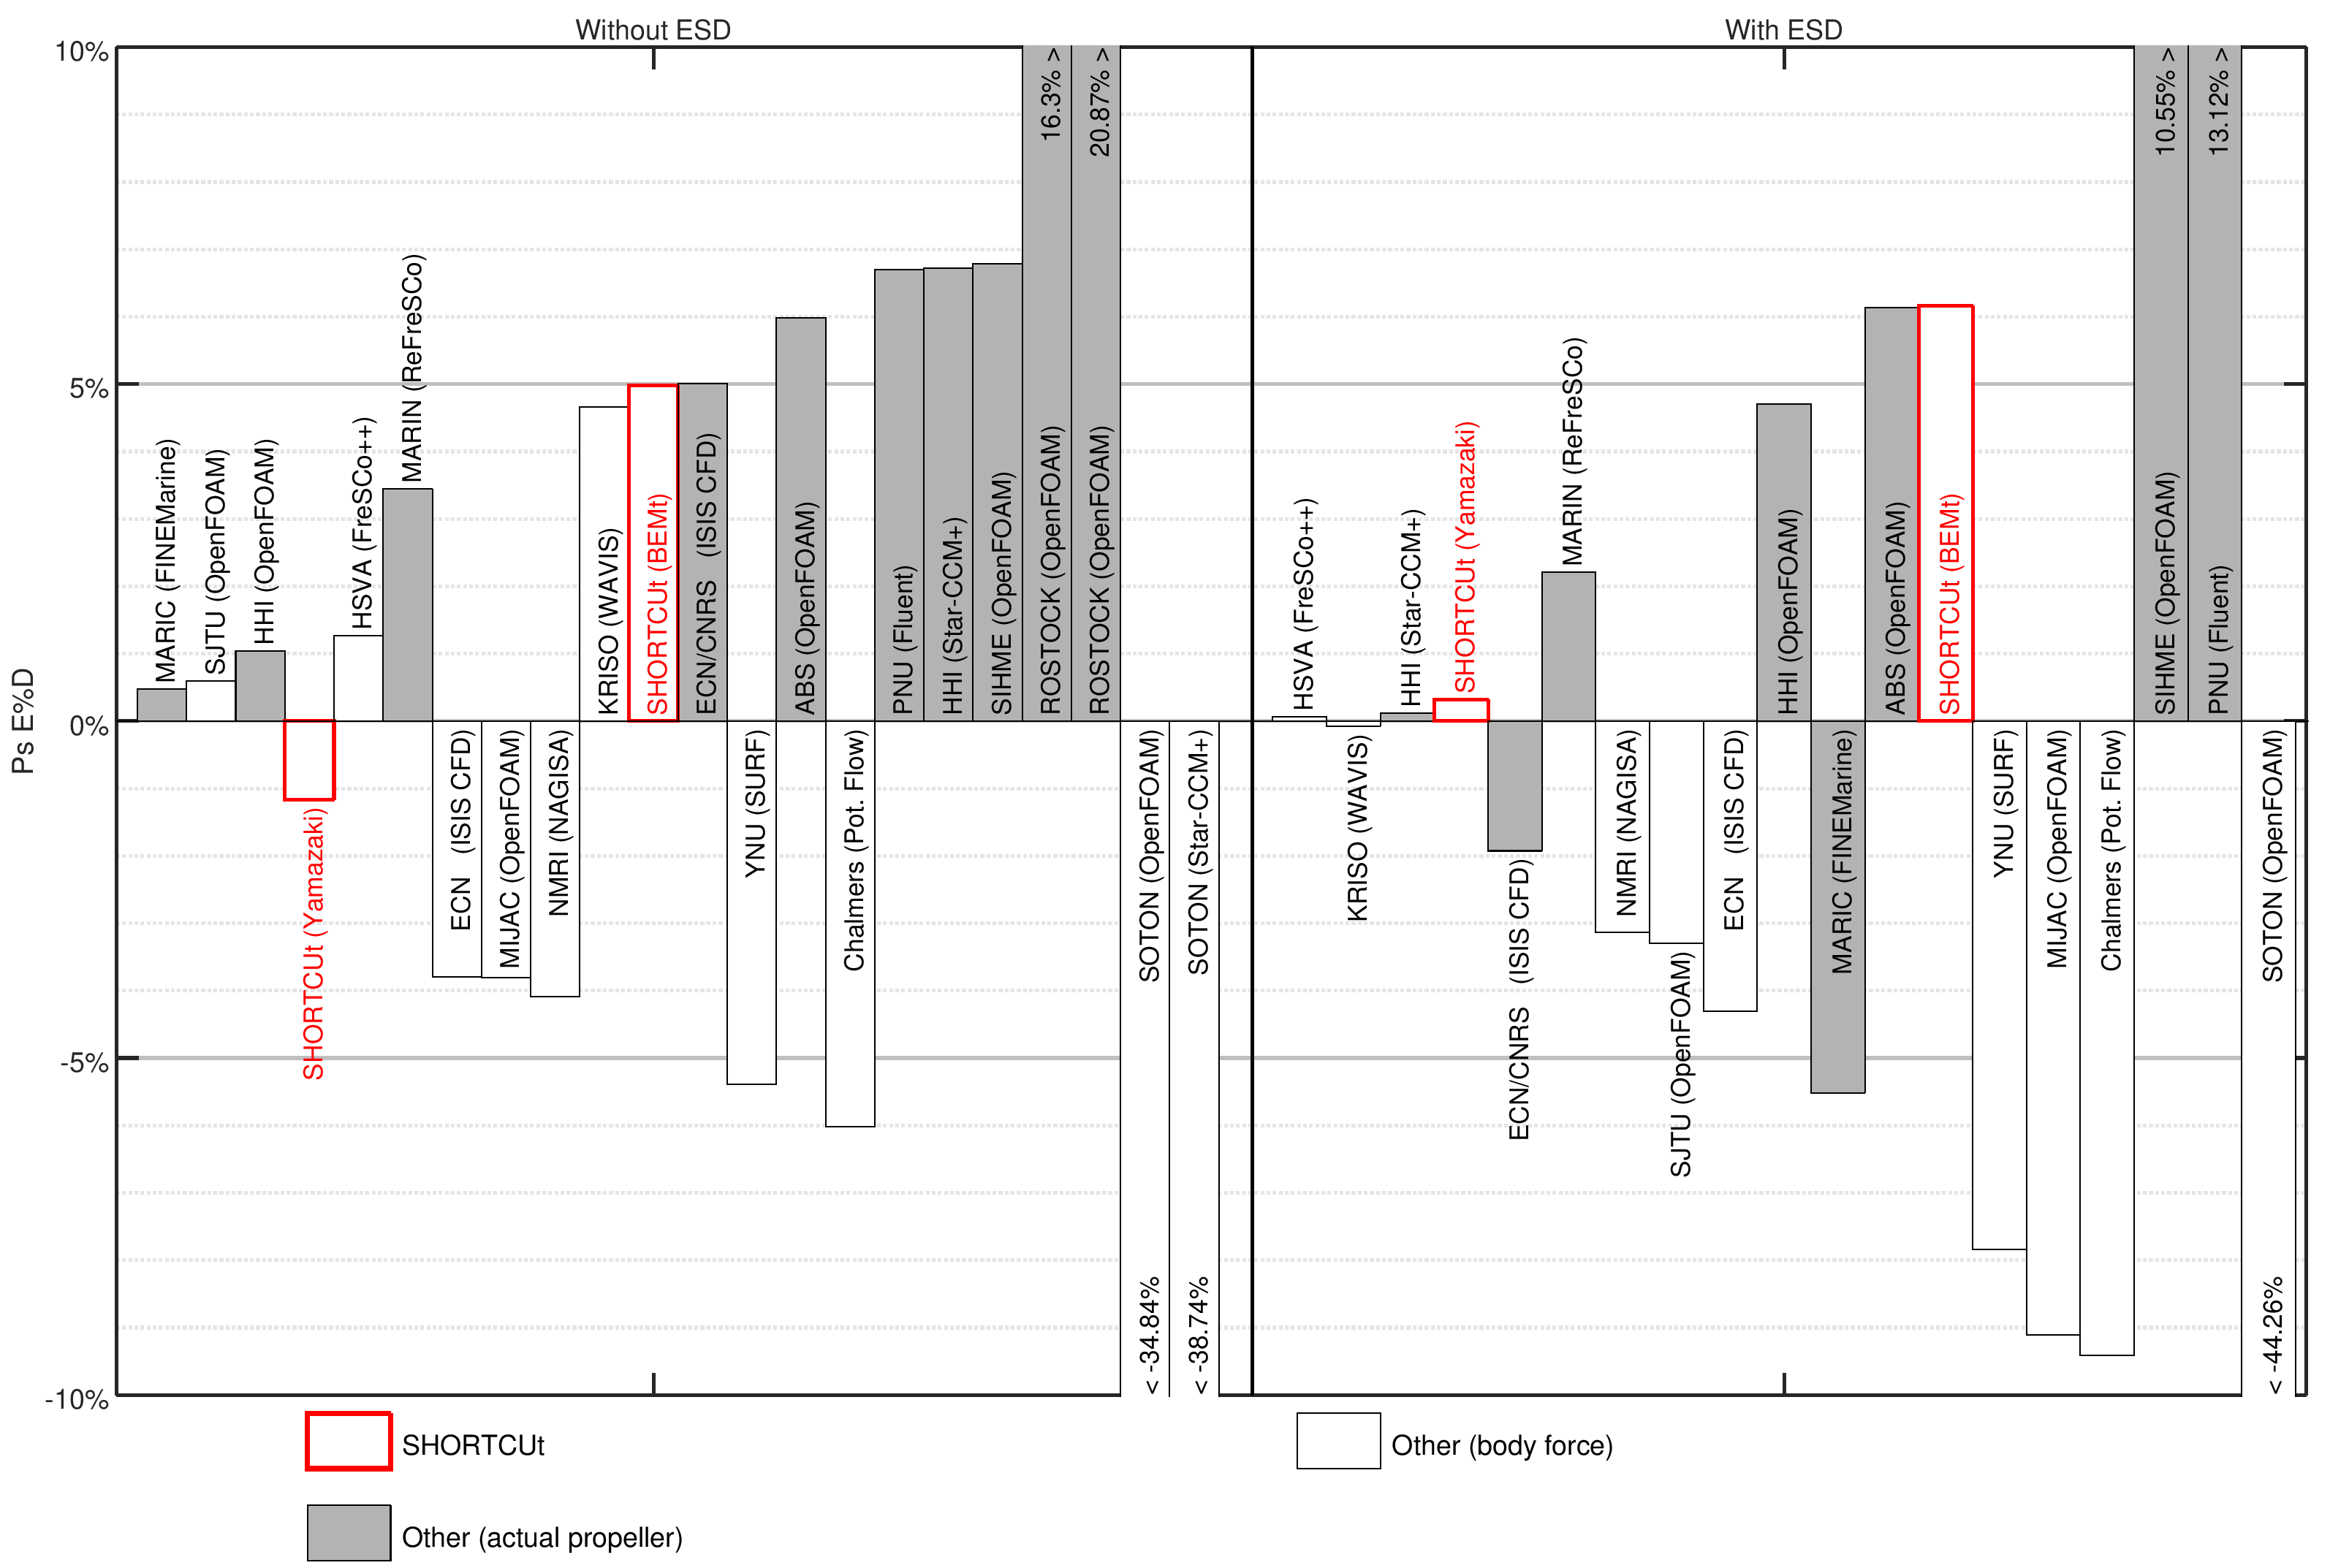
Relative error (compared to experiments) of the predicted powering requirement for the full scale ship by all submissions to the JBC benchmark case. Compared with SHORTCUt results. Without ESD (left) and With ESD (right).
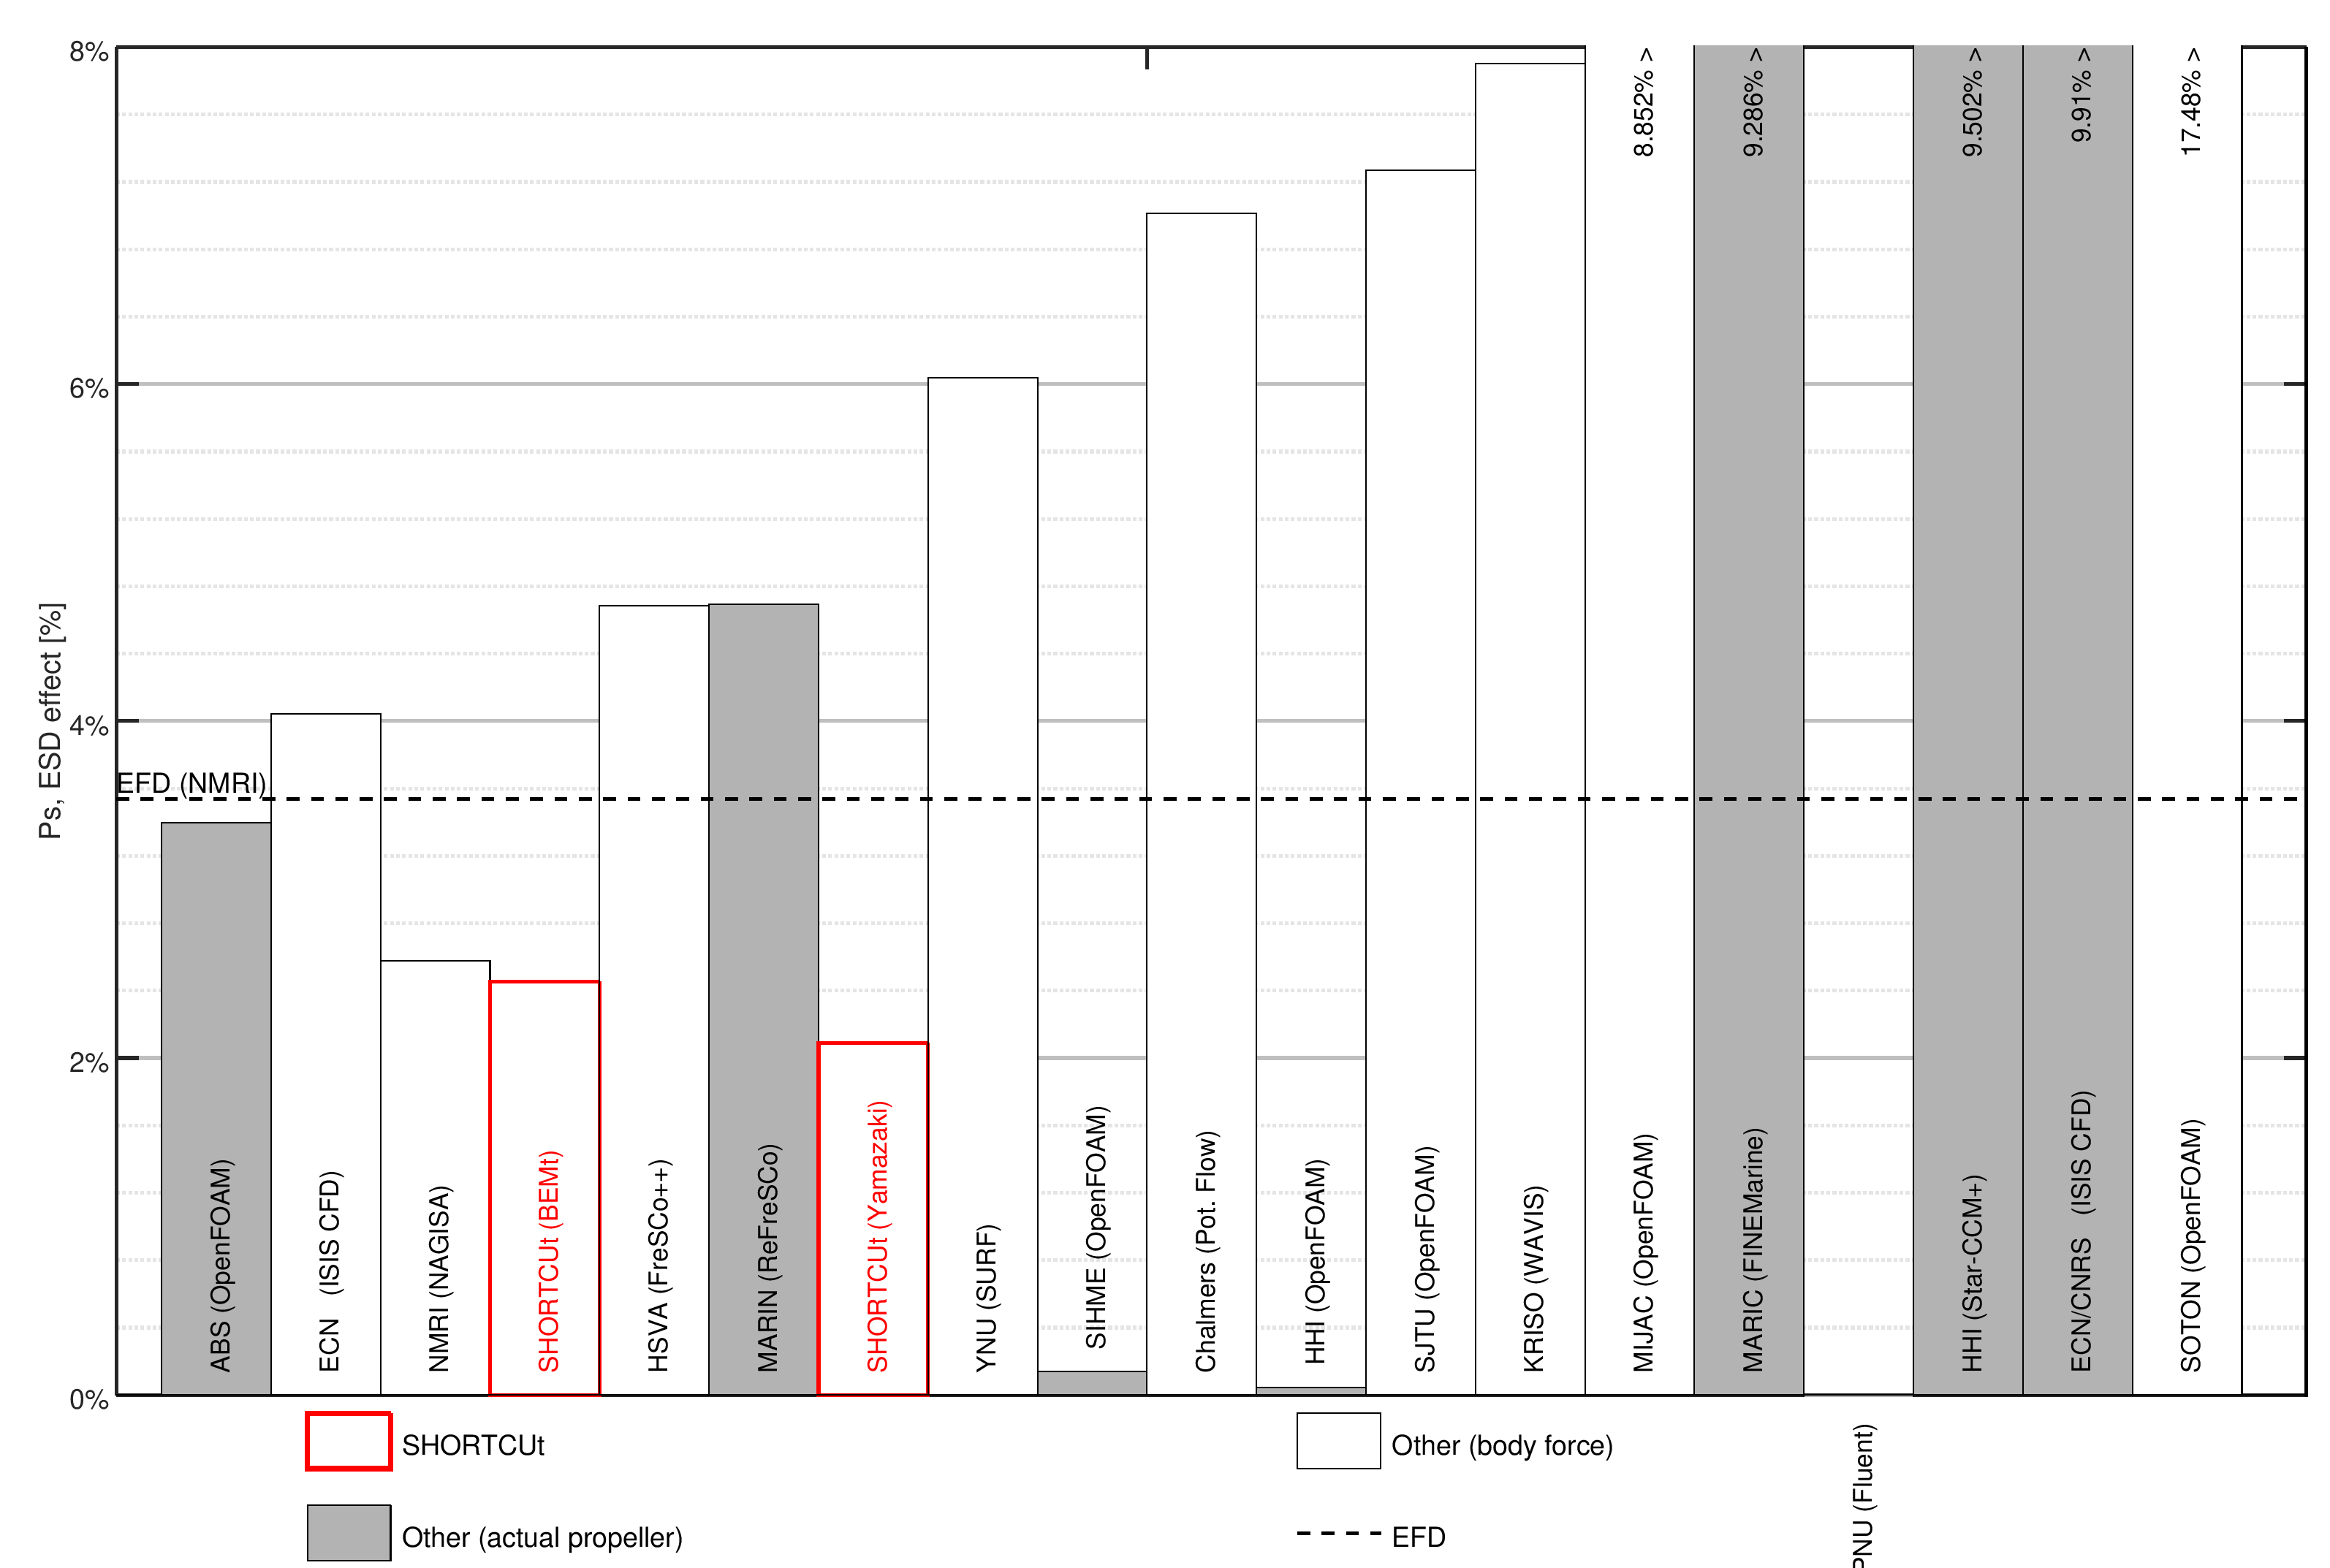
Predicted reduction in powering requirement due to ESD by all submissions to the JBC benchmark case. Compared with SHORTCUt results.
Rigorous verification of these results is possible using SHORTCUts scale factor (see the user guide). Here, an example of convergence of the predicted wake fraction and powering requirement of the JBC without the ESD is shown. The SHORTCUt scale factor is 1 for the finest mesh and is divided reduced in several steps in accordance with recommended prodecure. The resulting total mesh sizes are also shown.
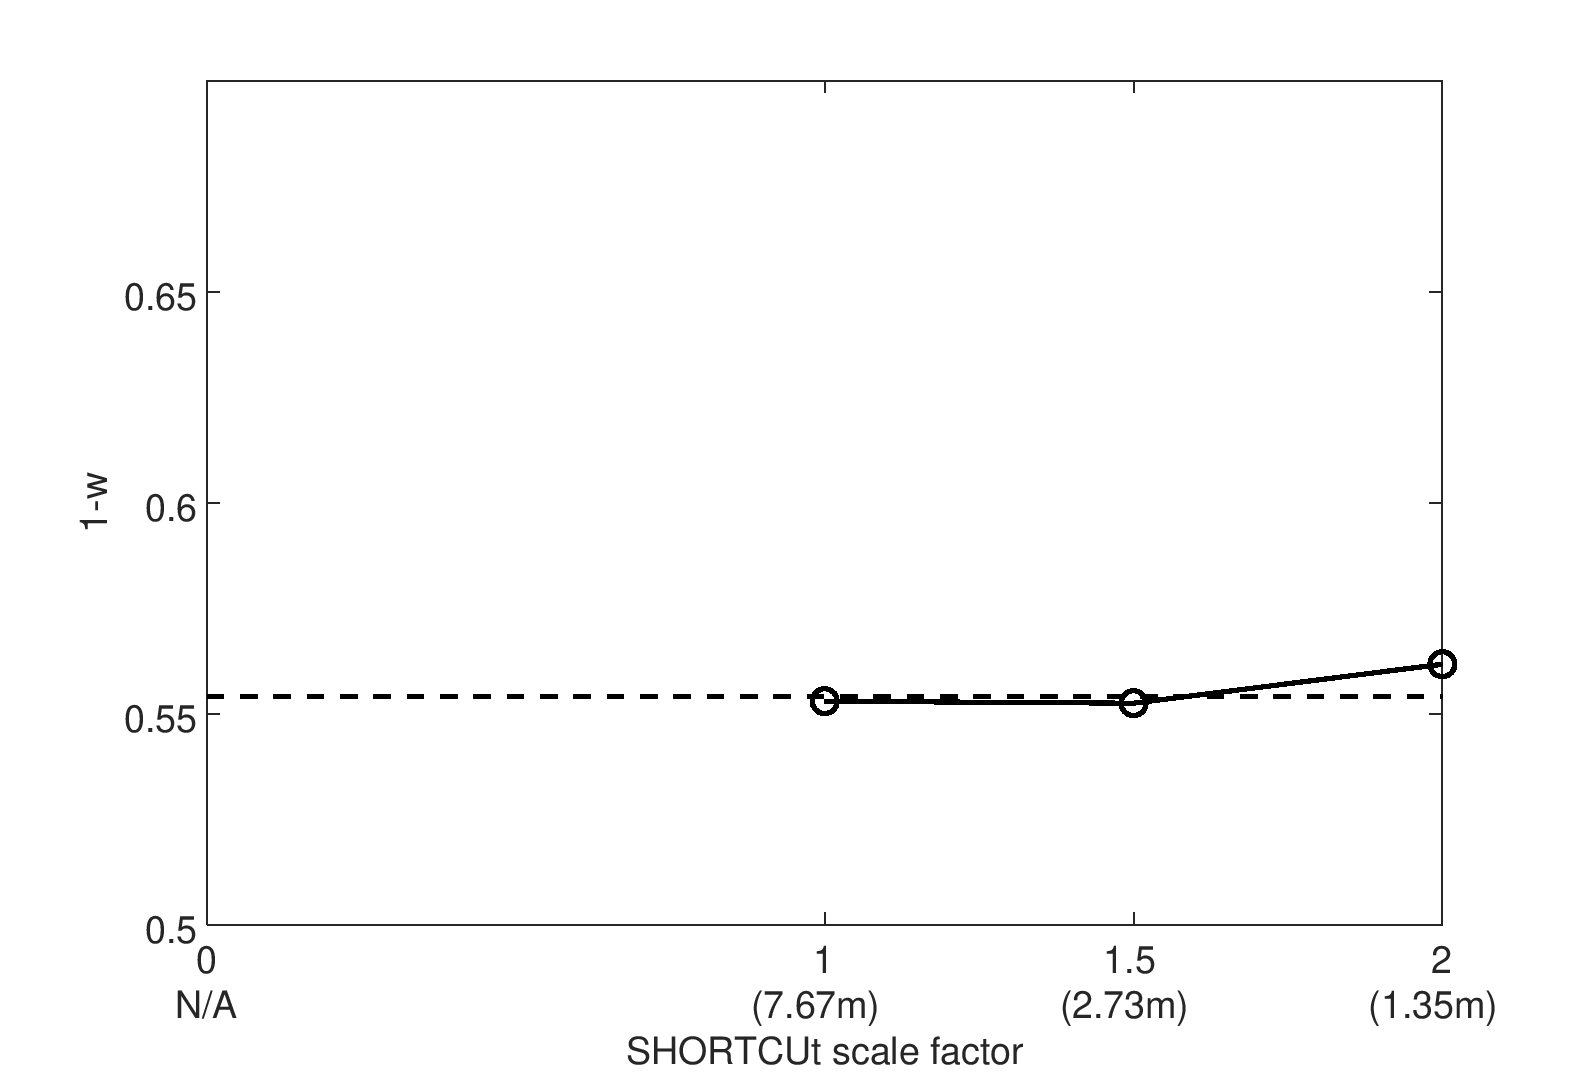
Mesh independence study of the predicted wake fraction; achieved by varying the SHORTCUt scale factor.
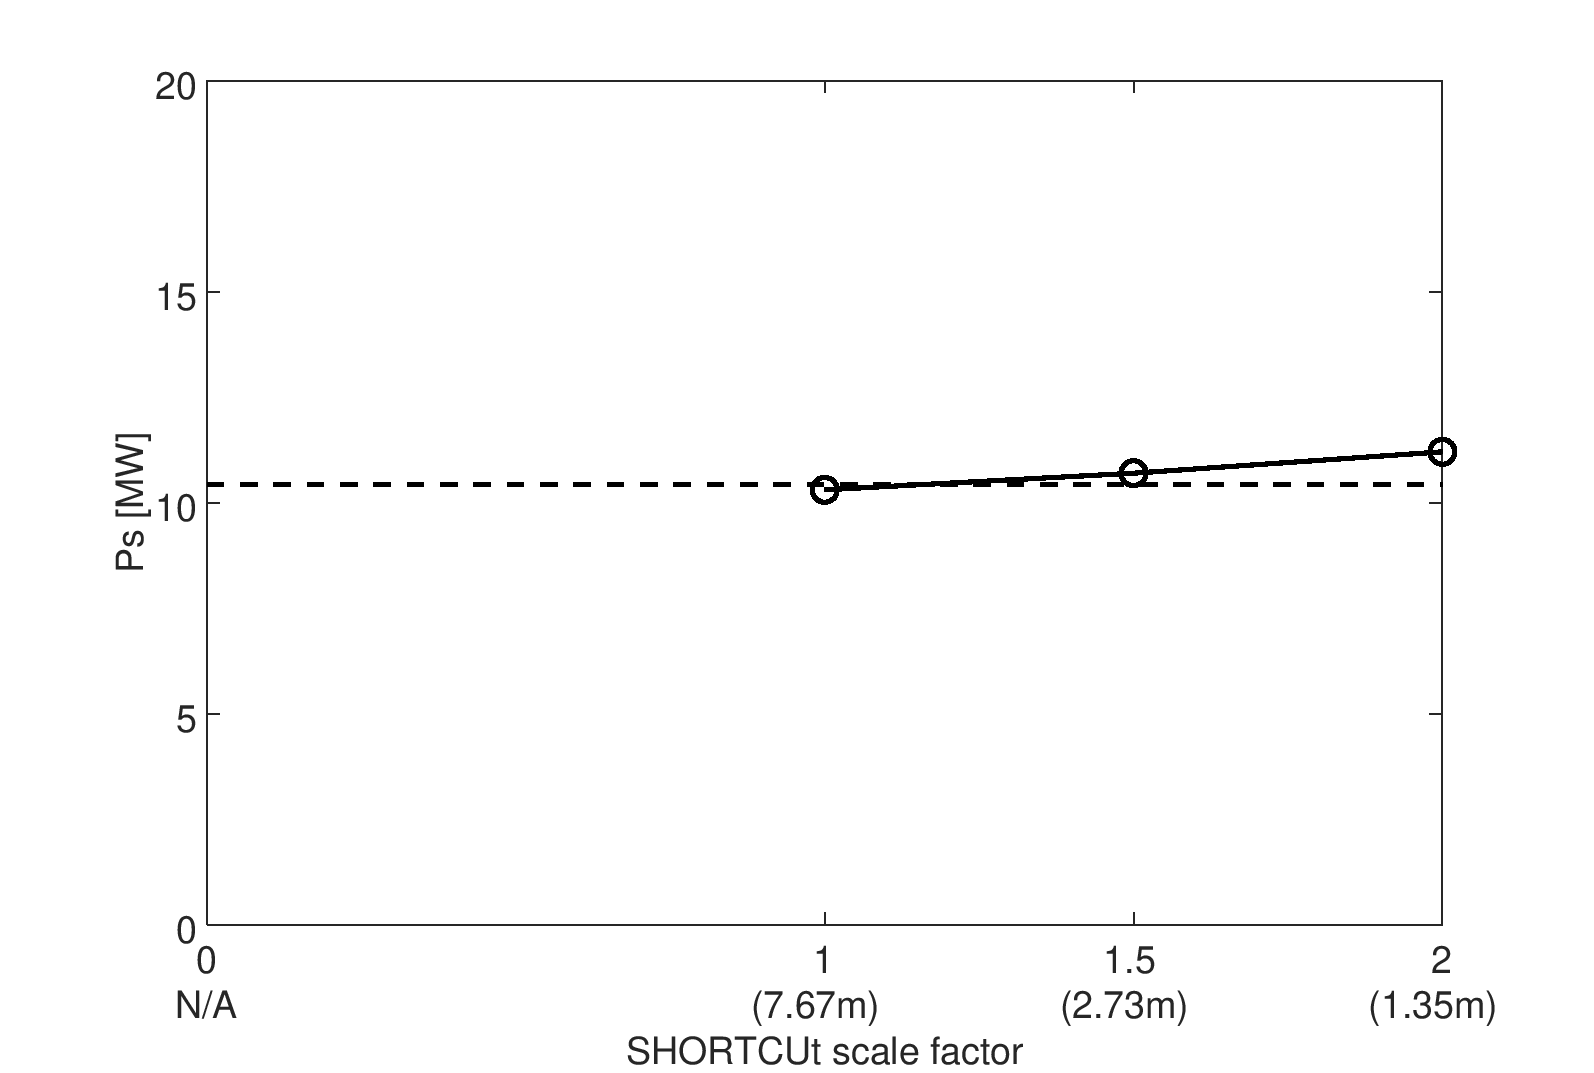
Mesh independence study of the predicted powering requirement for the full scale ship; achieved by varying the SHORTCUt scale factor.
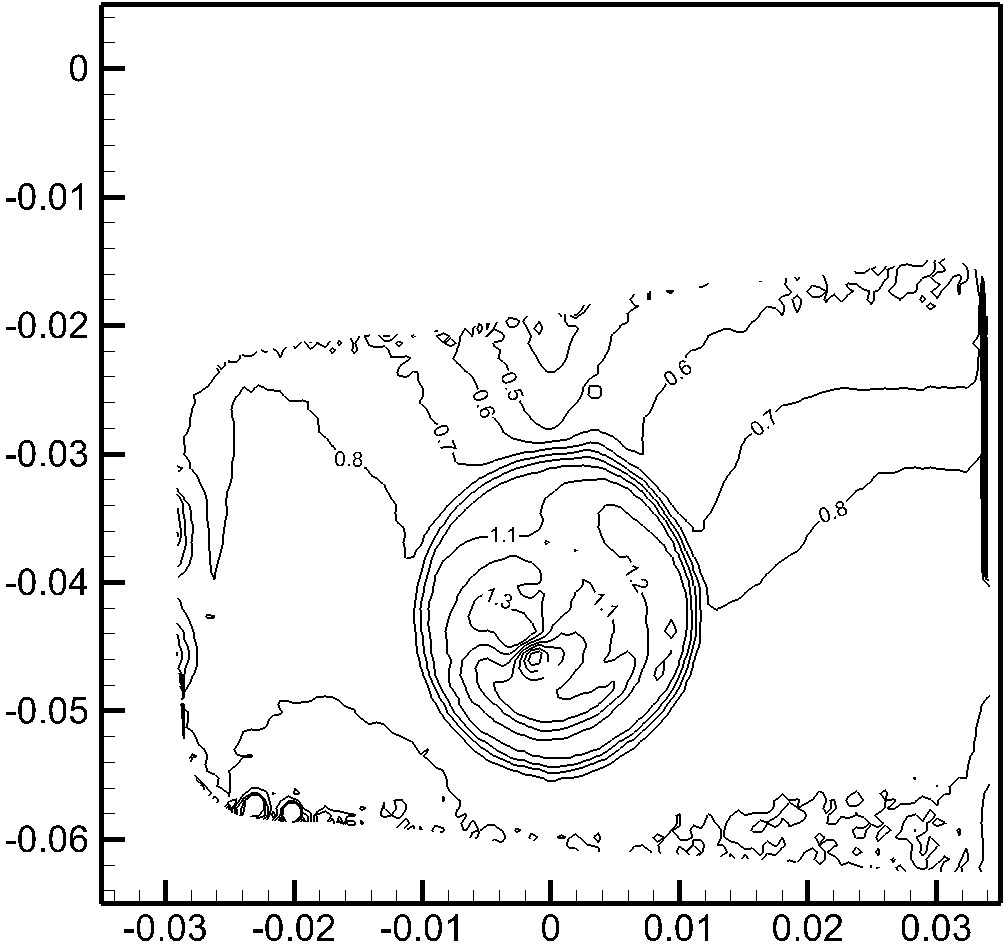
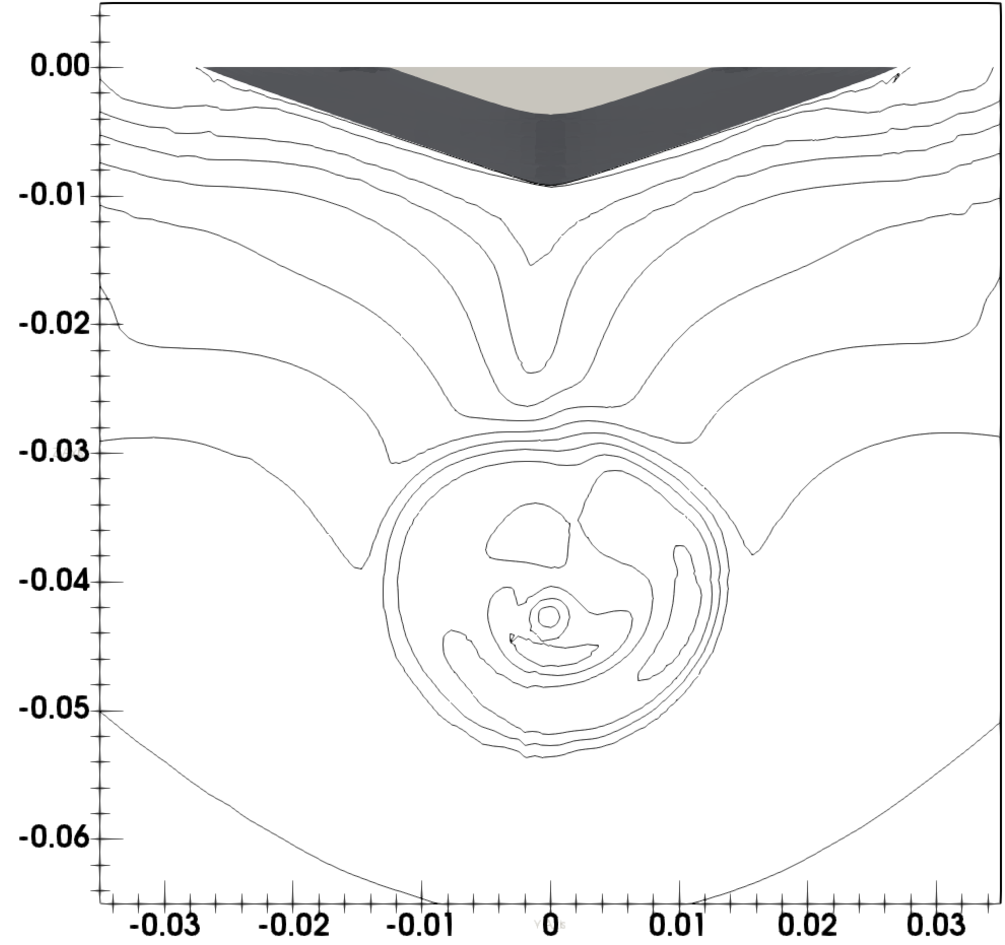
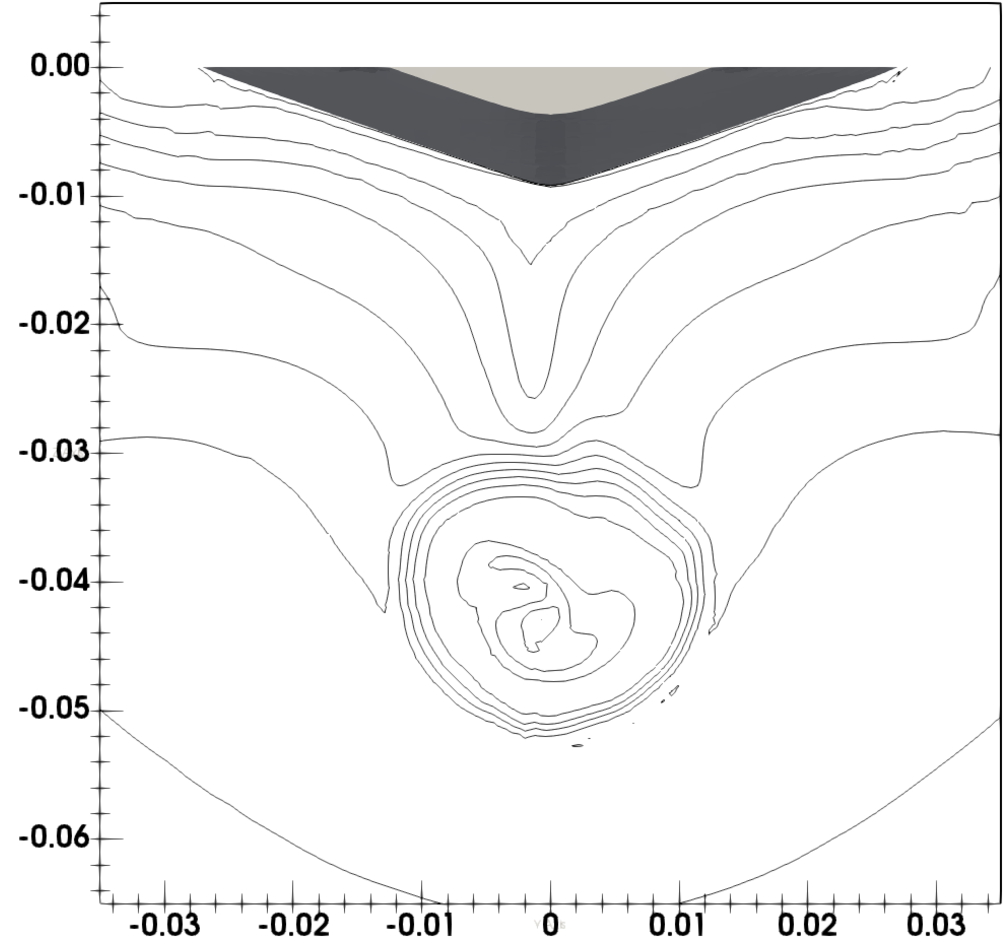
Local axial flow (Ux) at AP. Without ESD.
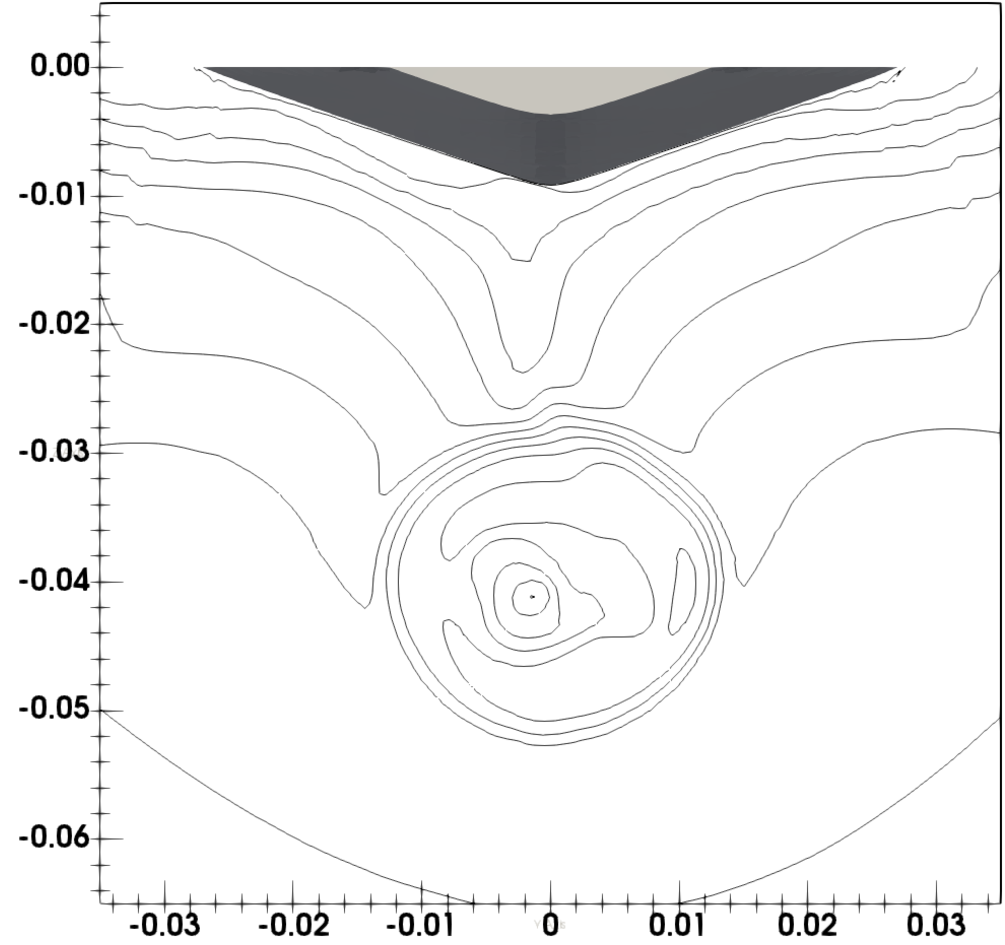
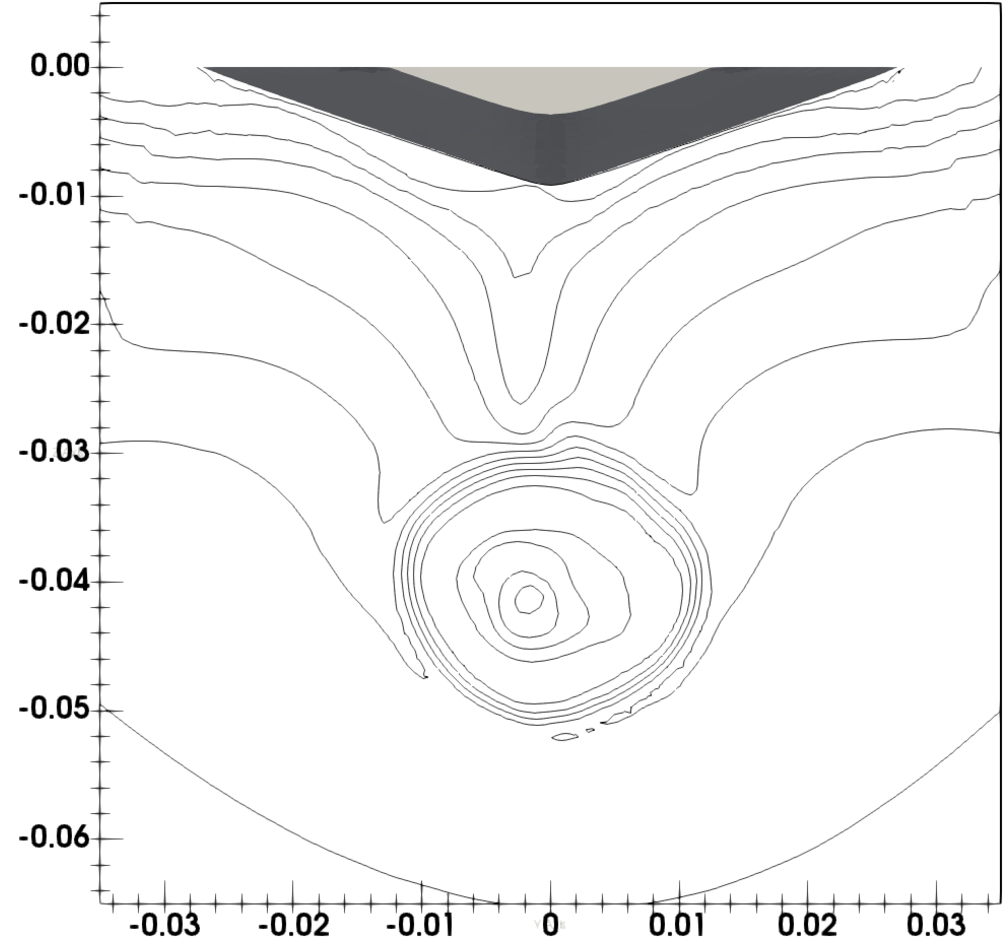
Local axial flow (Ux) at AP. With ESD.
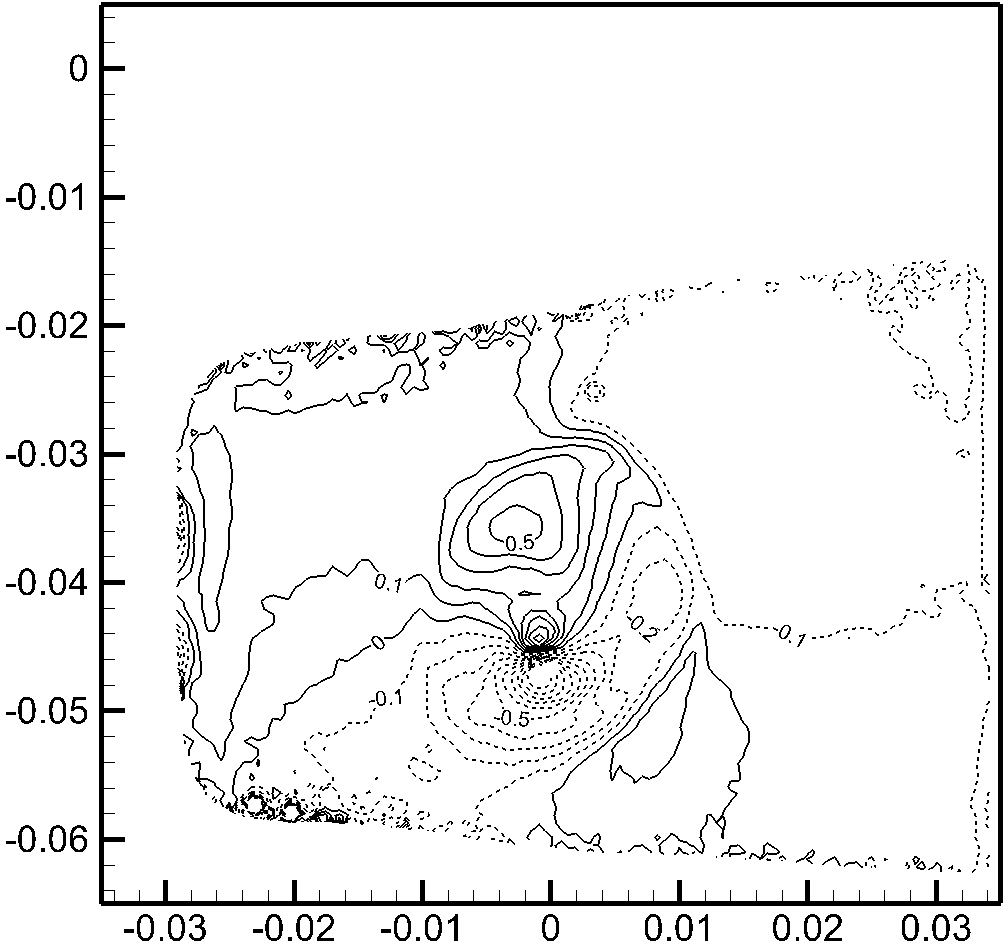
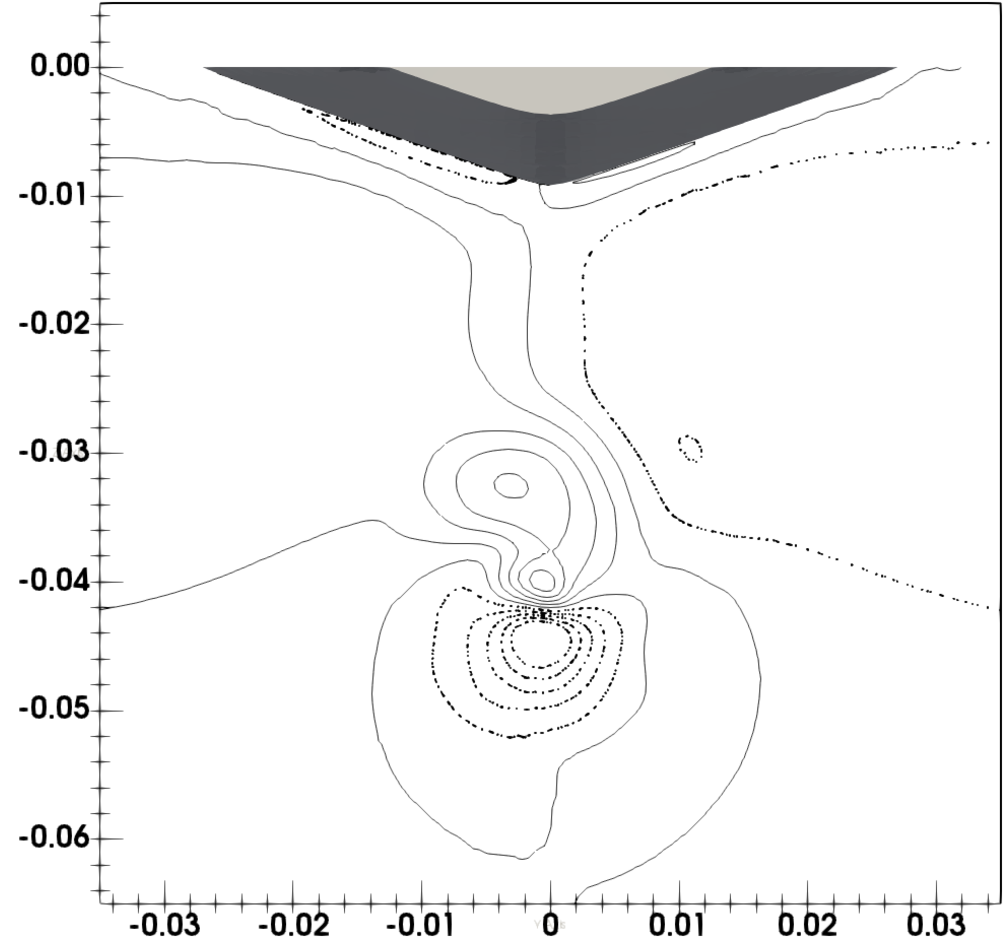
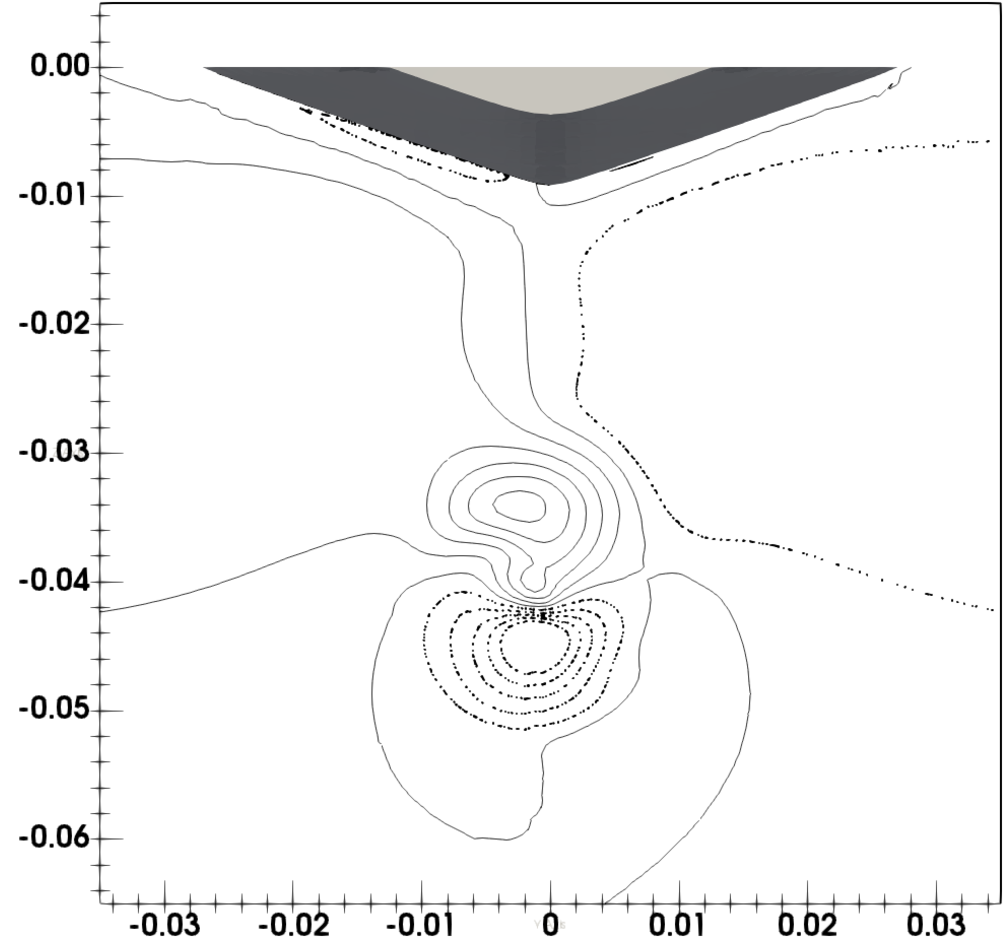
Local tangential flow (Uy) at AP. Without ESD.
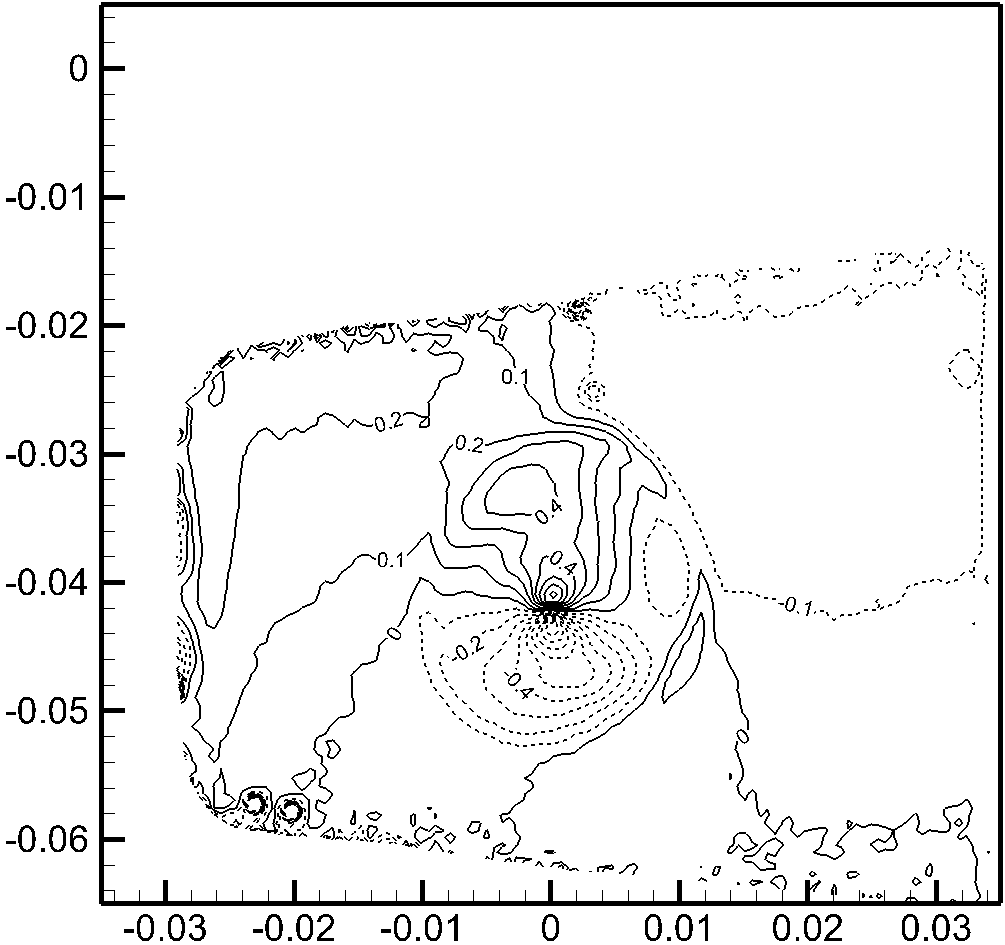
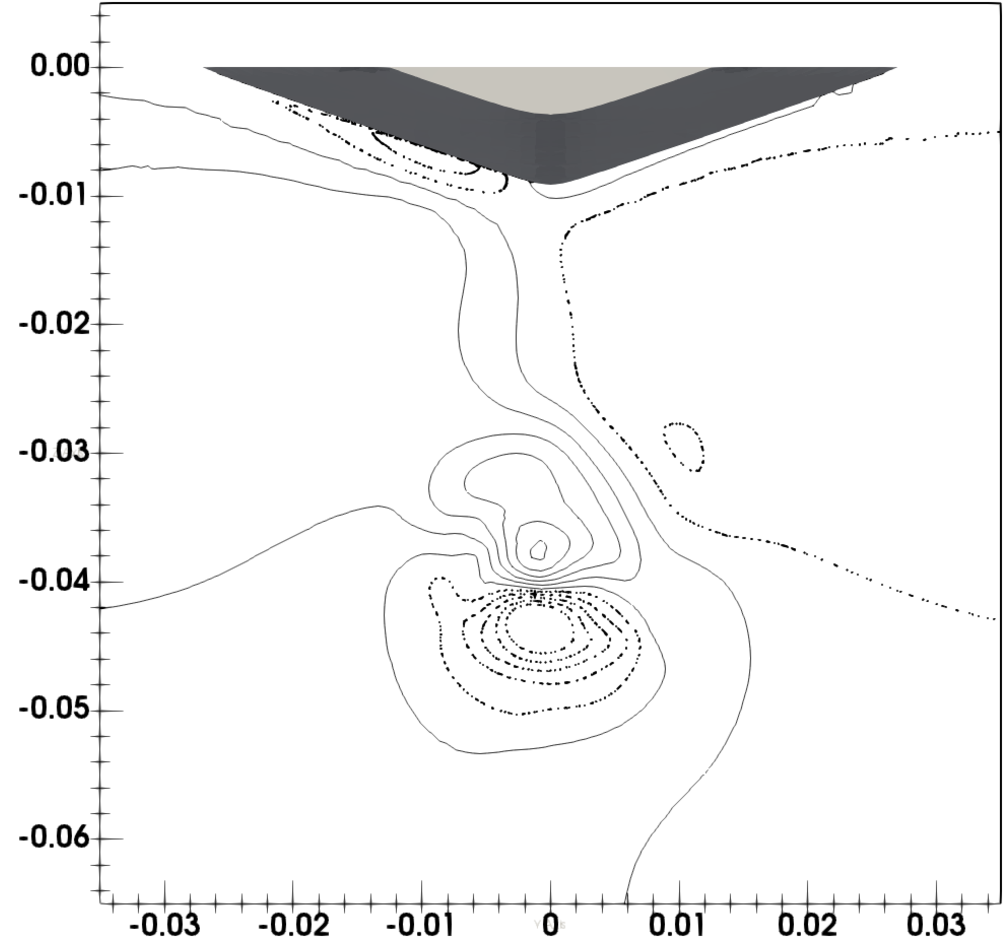
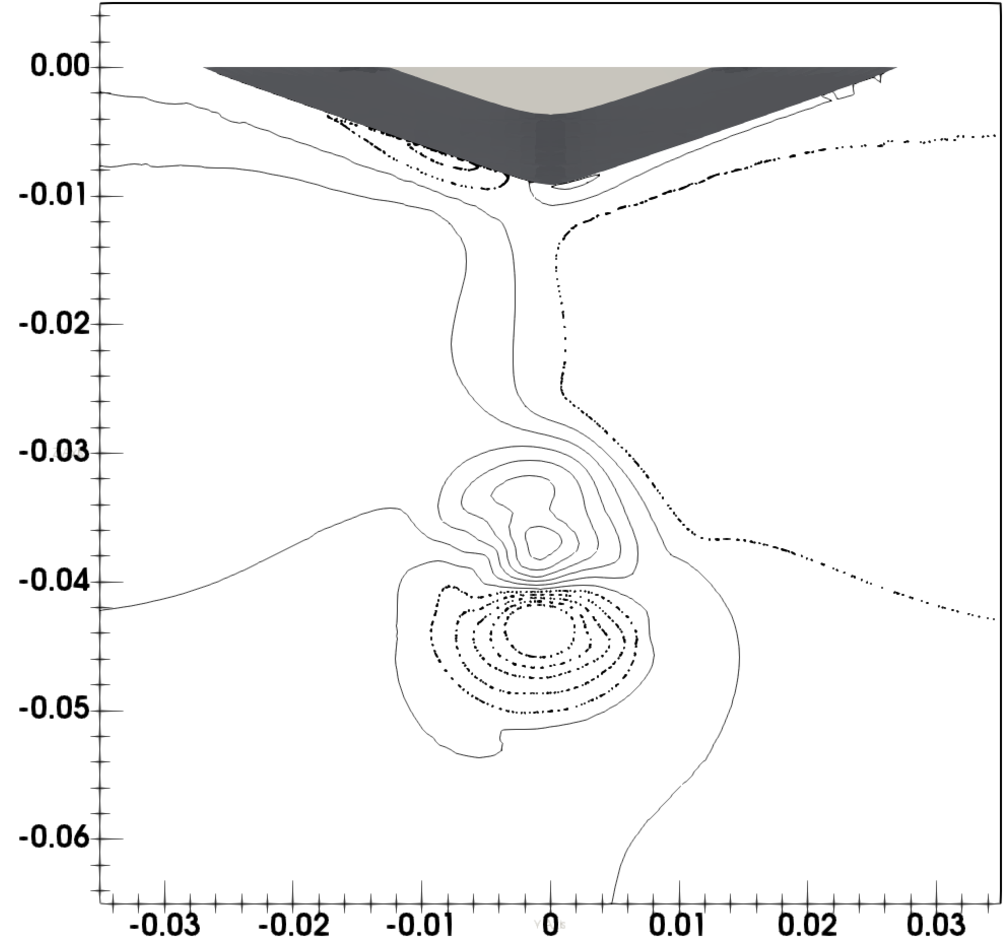
Local tagential flow (Uy) at AP. With ESD.
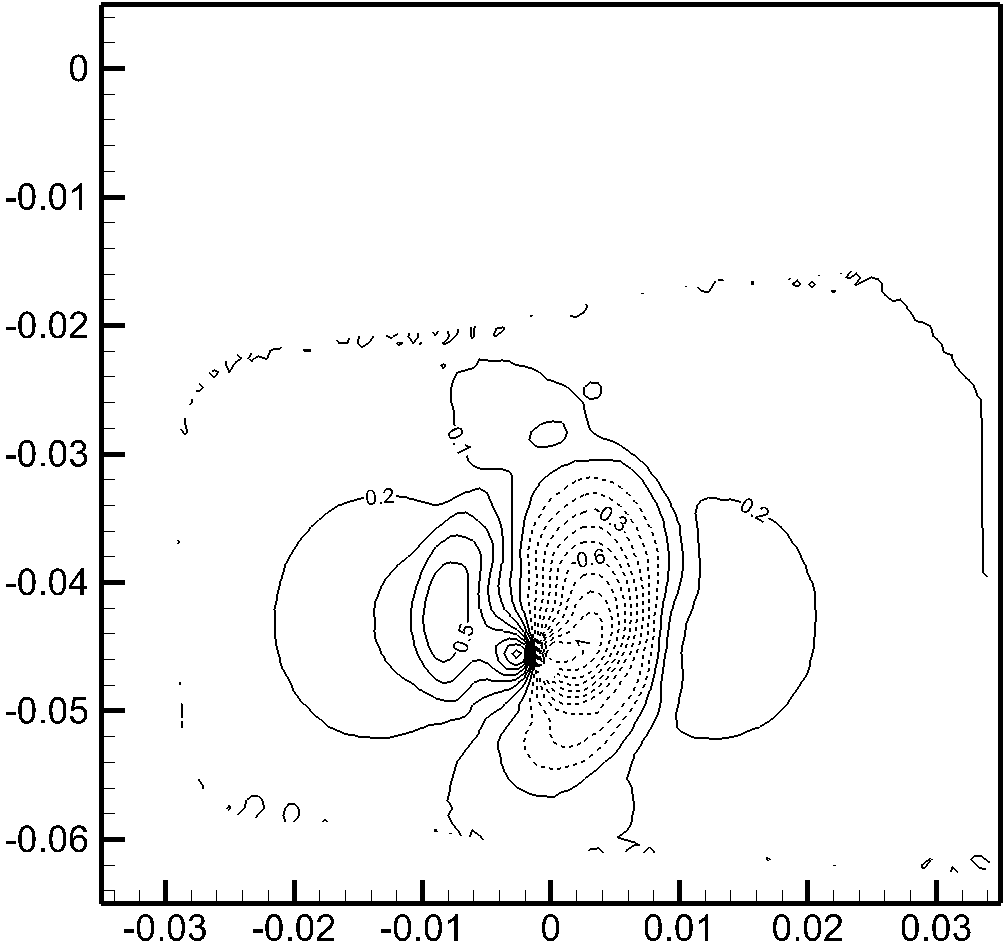
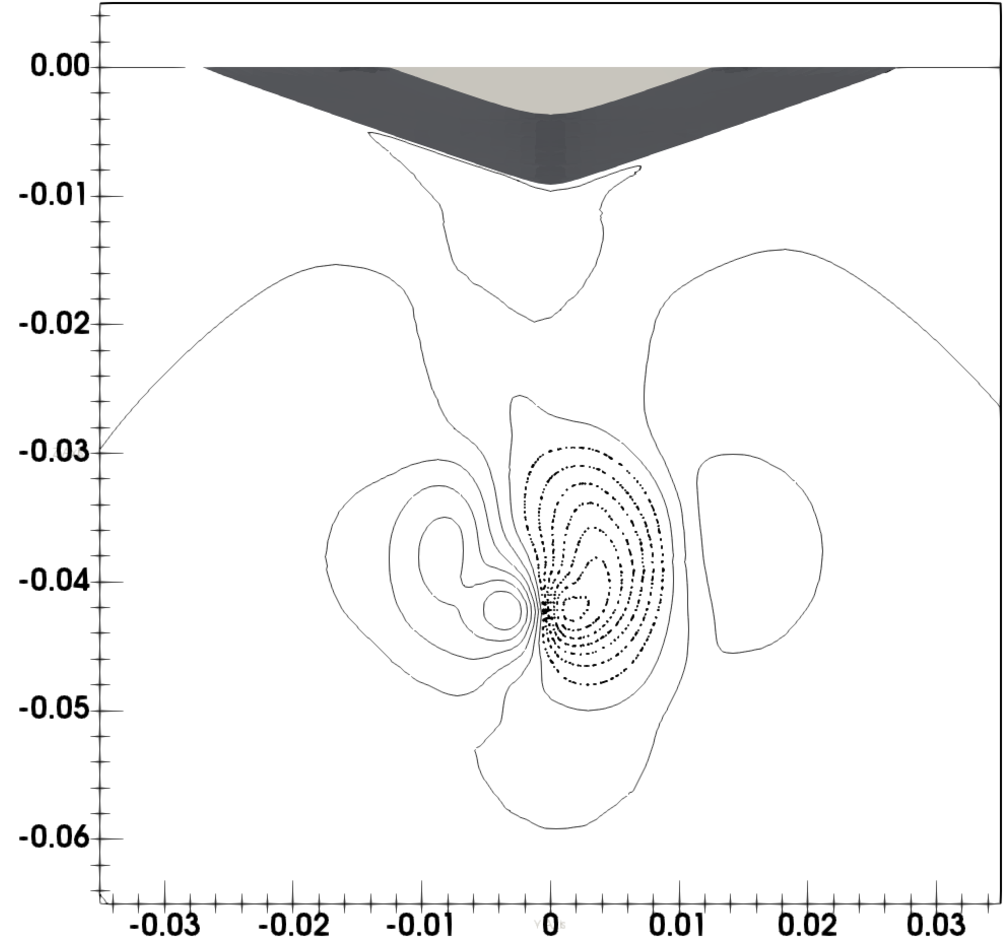
Local tangential flow (Uz) at AP. Without ESD.
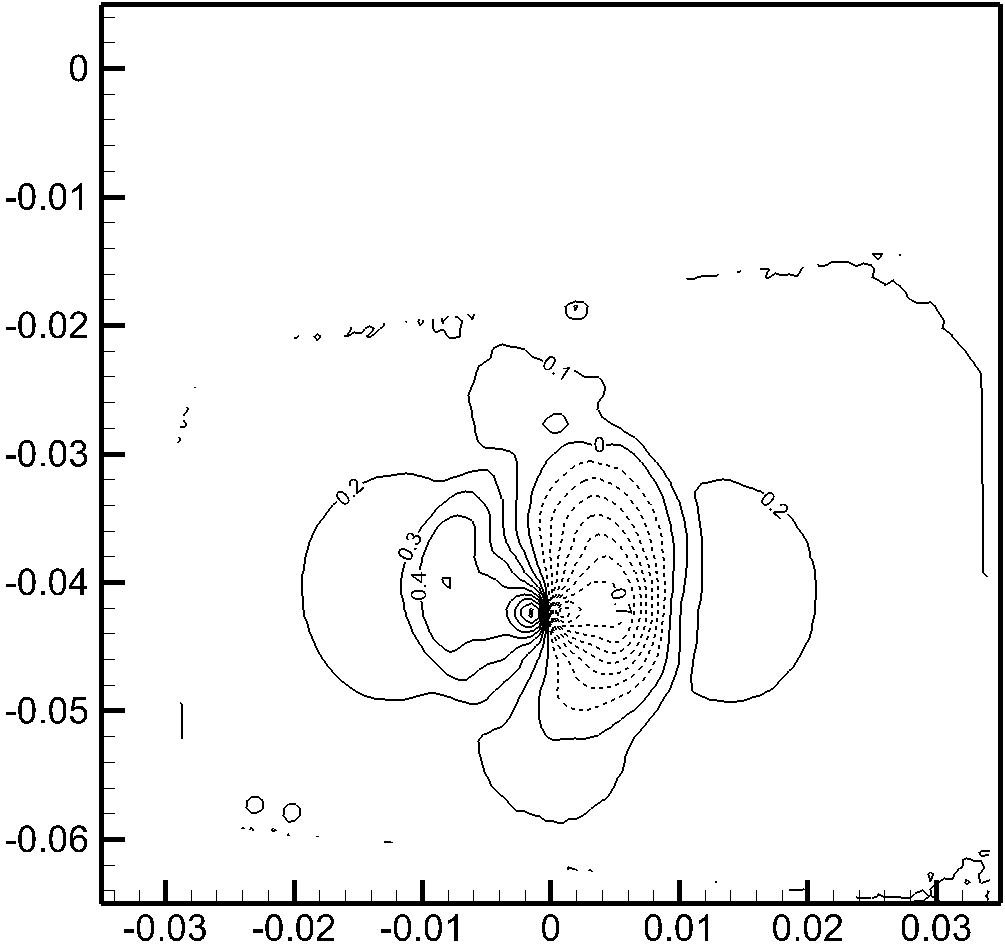
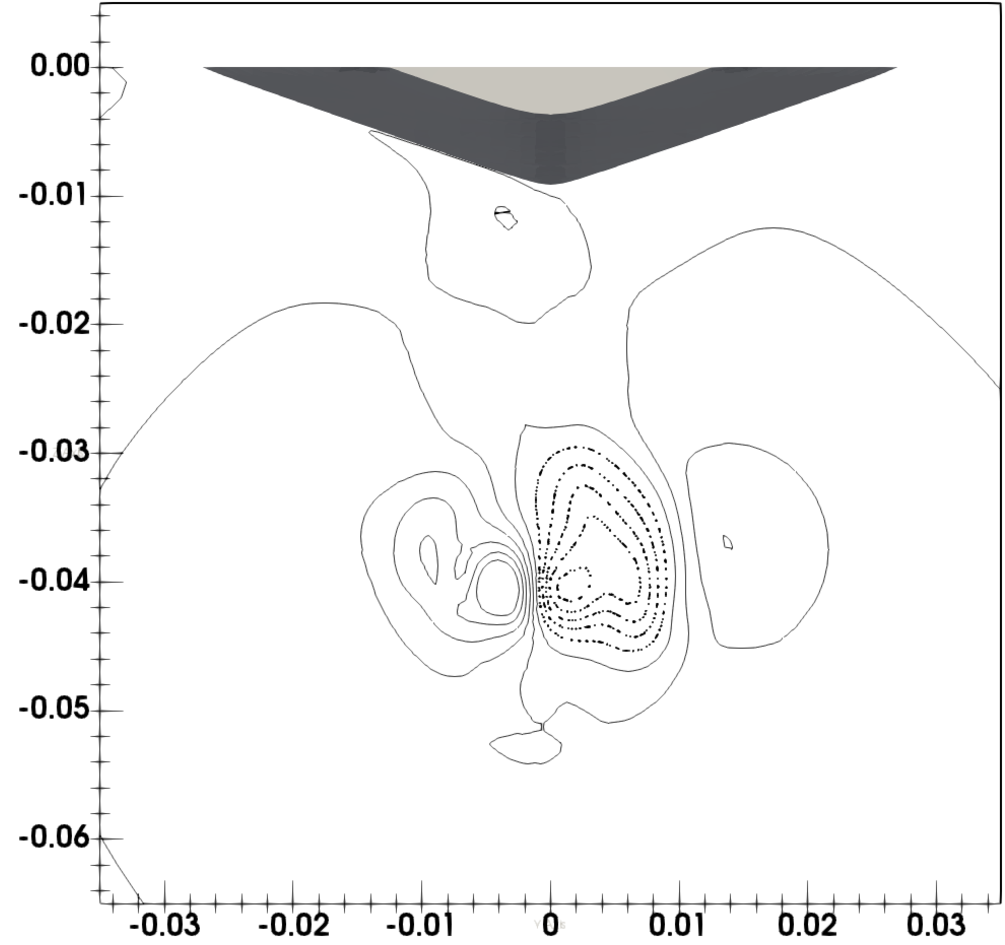
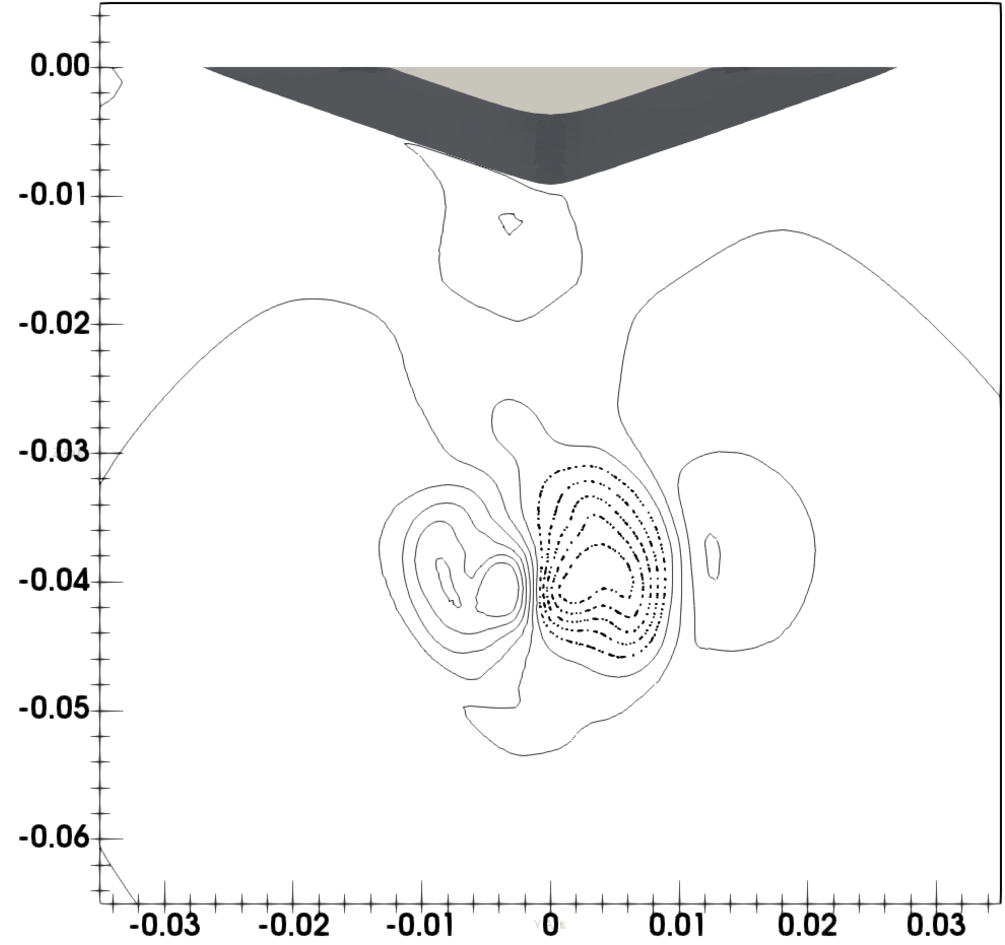
Local tagential flow (Uz) at AP. With ESD.
Finally; these results were obtained on a standard laptop using 3 cores. The specifications of the machine and the computational effort required are detailed below.
The KCS is a benchmark case for determining the flow around a modern container ship. Experimental data regarding the self propulsion performance of the KCS was released as part of the Tokyo 2015 workshop on numerical hydrodynamics. Many leading institutions have submitted calculation results for comparison with this experimental data. These results represent the state of the art of marine CFD and were recently summarized and discussed in detail by Hino et.al. Eds. (2020).
Here, the experimental results, published by Hino et.al. Eds. (2020), are compared with results obtained with SHORTCUt and the self propulsion framework. This calculation is identical to the one obtained with SHORTCUts (v. 0.12) KCS tutorial settings.
| Property | Model Scale | Full Scale |
|---|---|---|
| Lpp | 7.2786m | 230m |
| Fn(Lpp) | 0.260 (2.196 m/s) | 0.260 (24 kn) |
| Wetted surface area | 9.4379 m2 | 9424 m2 |
| Propeller | ||
| Diameter | 0.250m | 7.9m |
| No. blades | 5 | 5 |
| Rotation direction | Clockwise | Clockwise |
The axial flow contours behind the propeller of the KCS in this condition was presented as part of the benchmarking data in the Tokyo workshop. These are compared to those calculated by SHORTCUts Yamazaki model below.
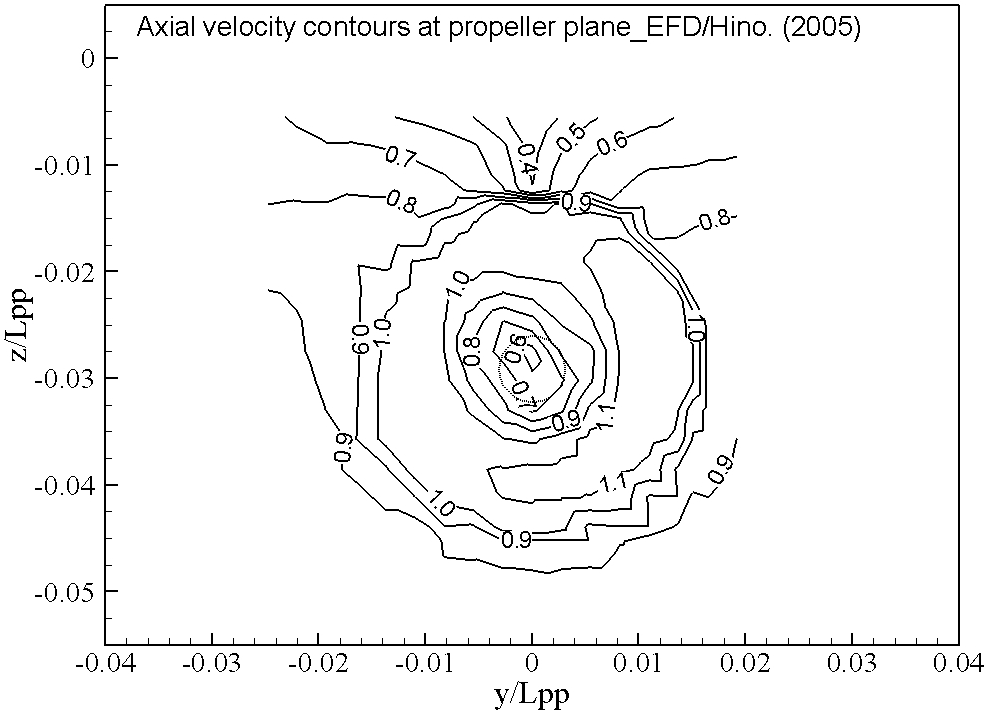
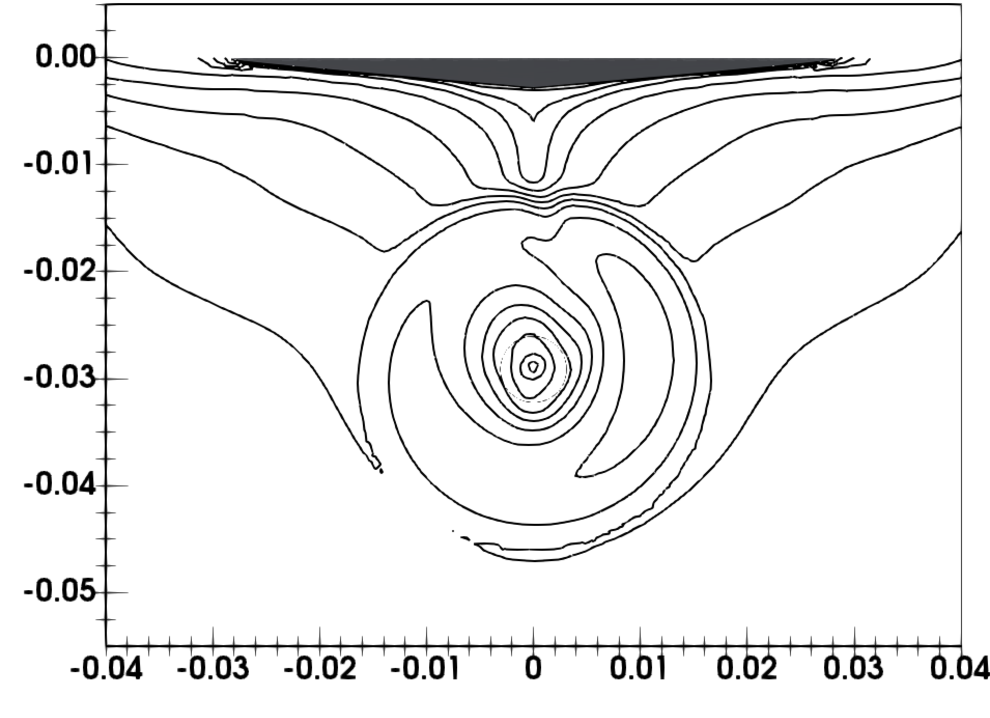
Local axial flow (Ux) at x/Lpp=0.4911.
Only four submissions to the Tokyo workshop presented results for a calculated self propulsion point of the KCS. The rest fixed the RPM to the experimental value of 9.5 rps. The results by SHORTCUt (using a the self propulsion point finder propeller controller) are shown here together with the submissions that did vary the RPM. SHORTCUt fares slightly less well against these results compared to the ones for the JBC. This is likely due to the increased importance of the free surface for the KCS; in terms of the pressure distribution on the hull and propeller. All other numerical submissions to the Tokyo 2015 workshop included the free surface in their calculations. The SHORTCUt results on the other hand, are calculated using a double model simulation.
However, SHORTCUts local flow predictions behind the propeller are highly competitive and proves that even the double model simulation is very useful for studying propeller/hull/rudder interaction for the KCS.
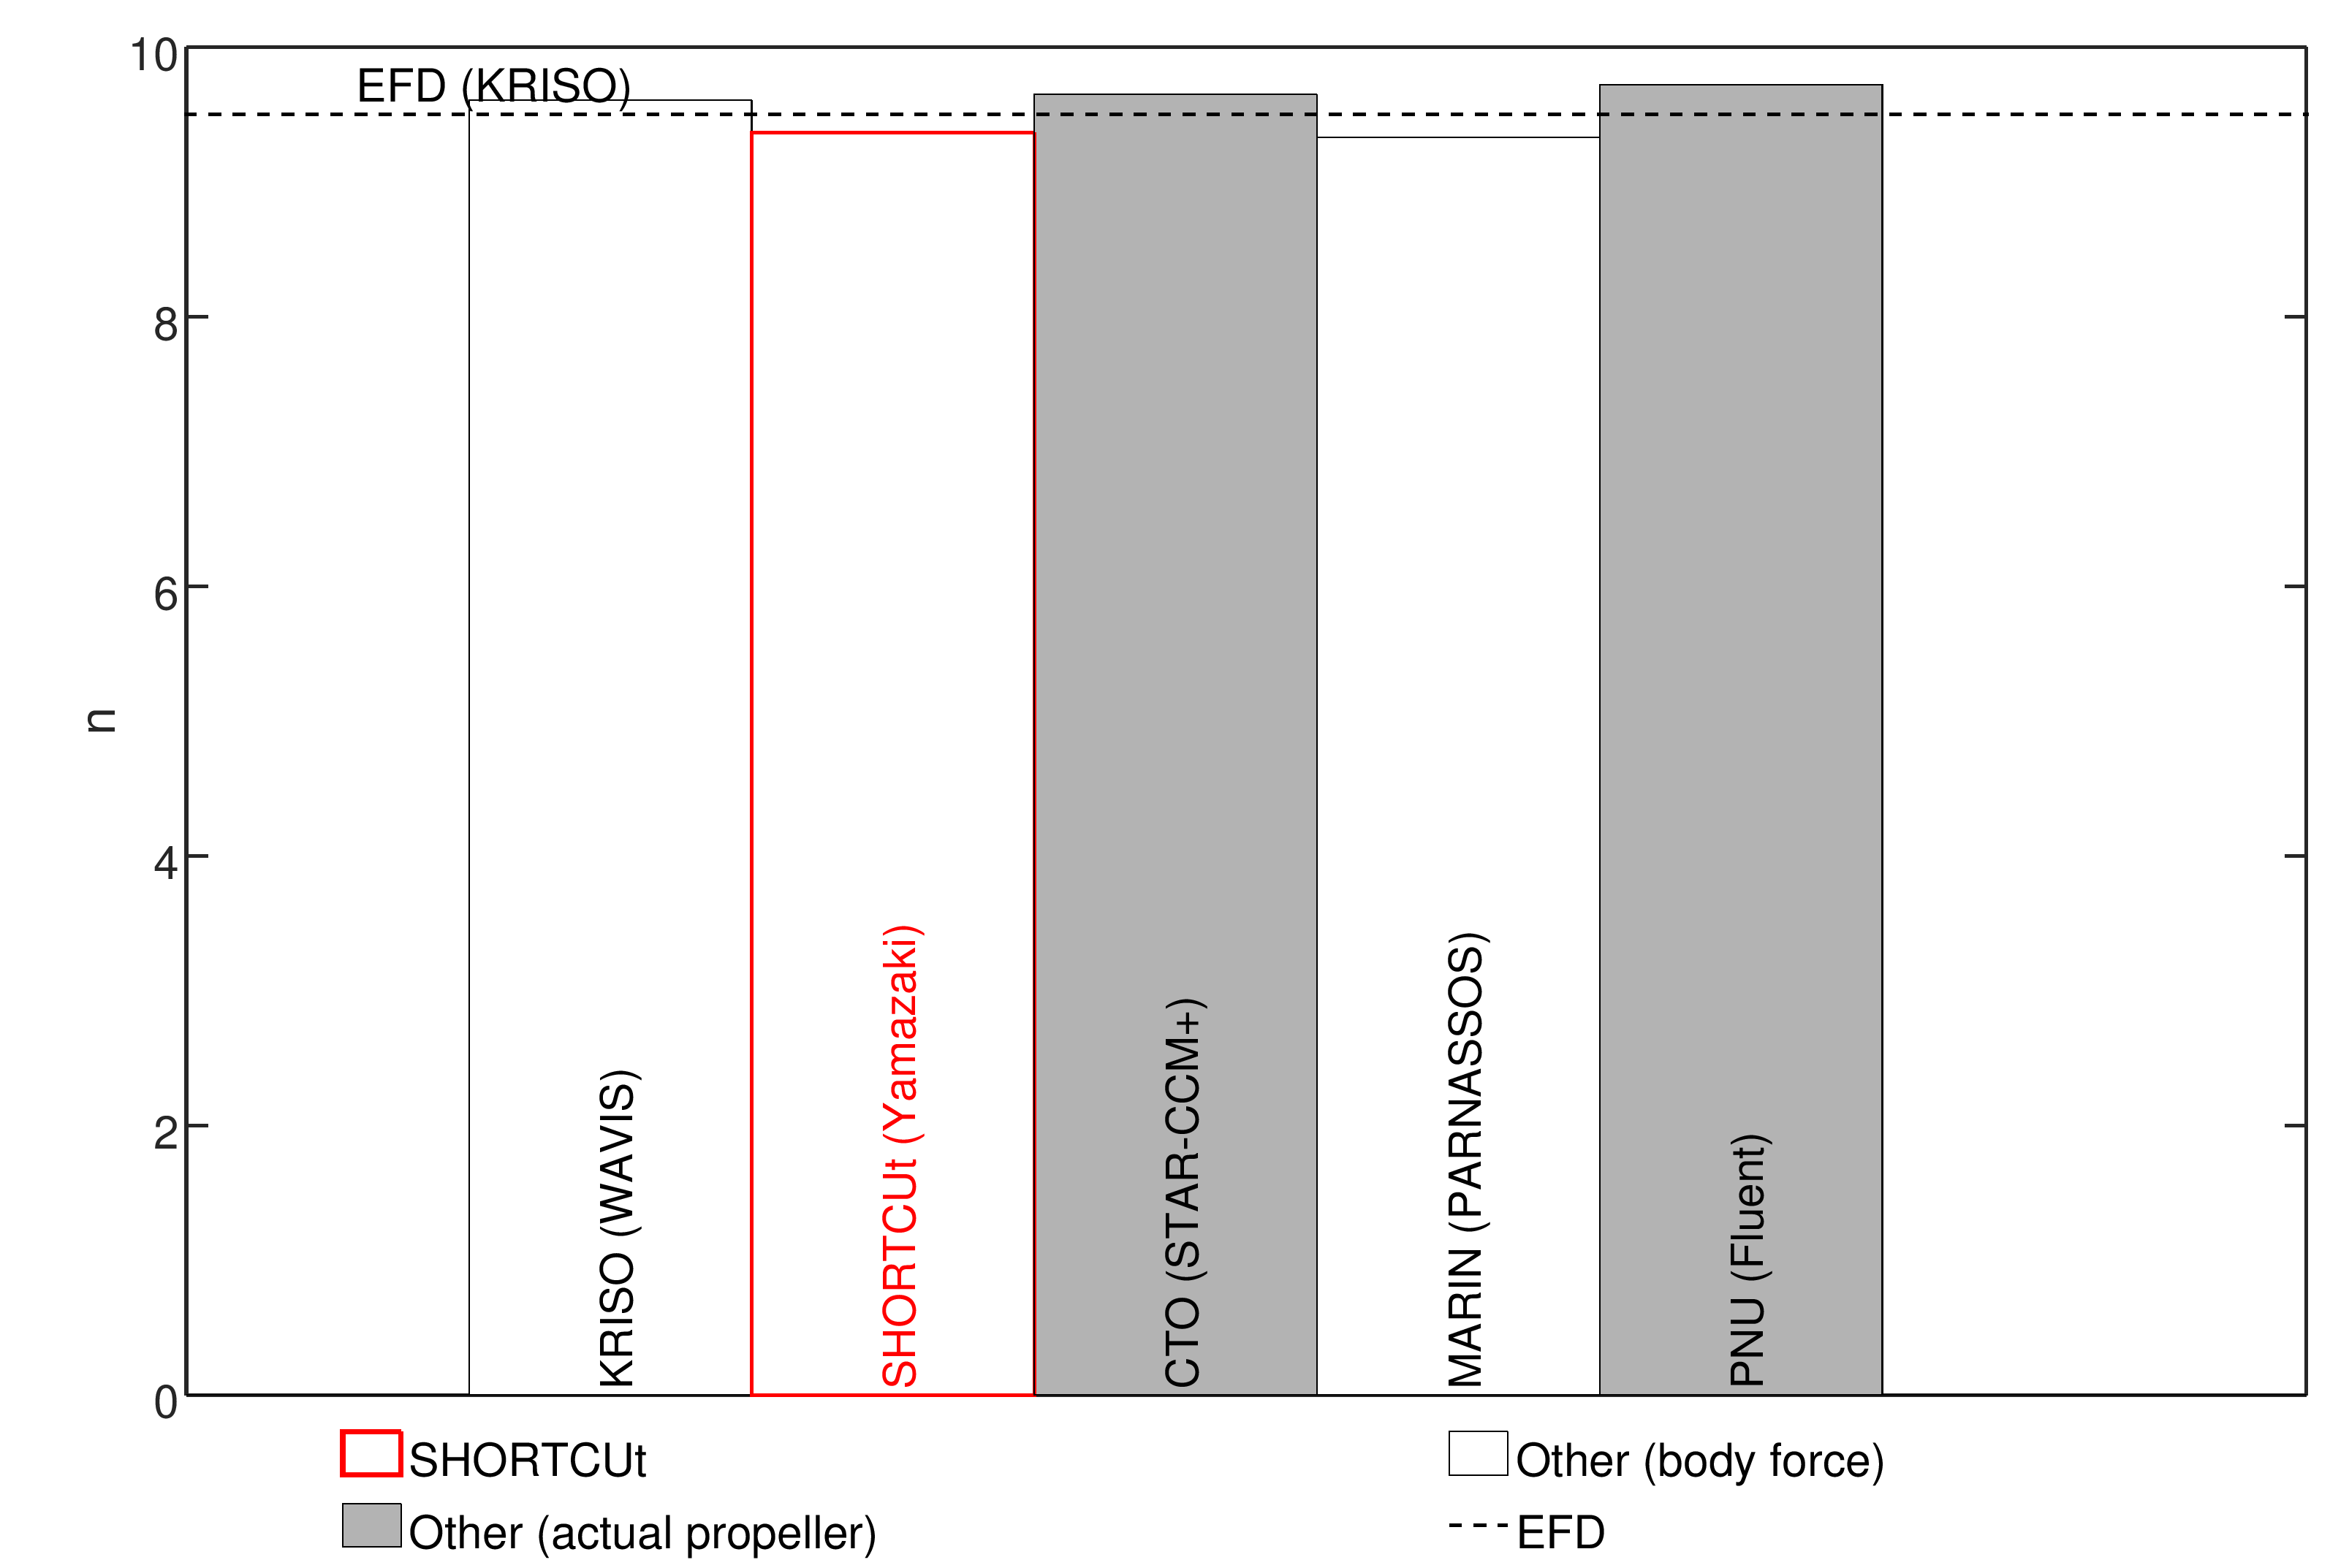
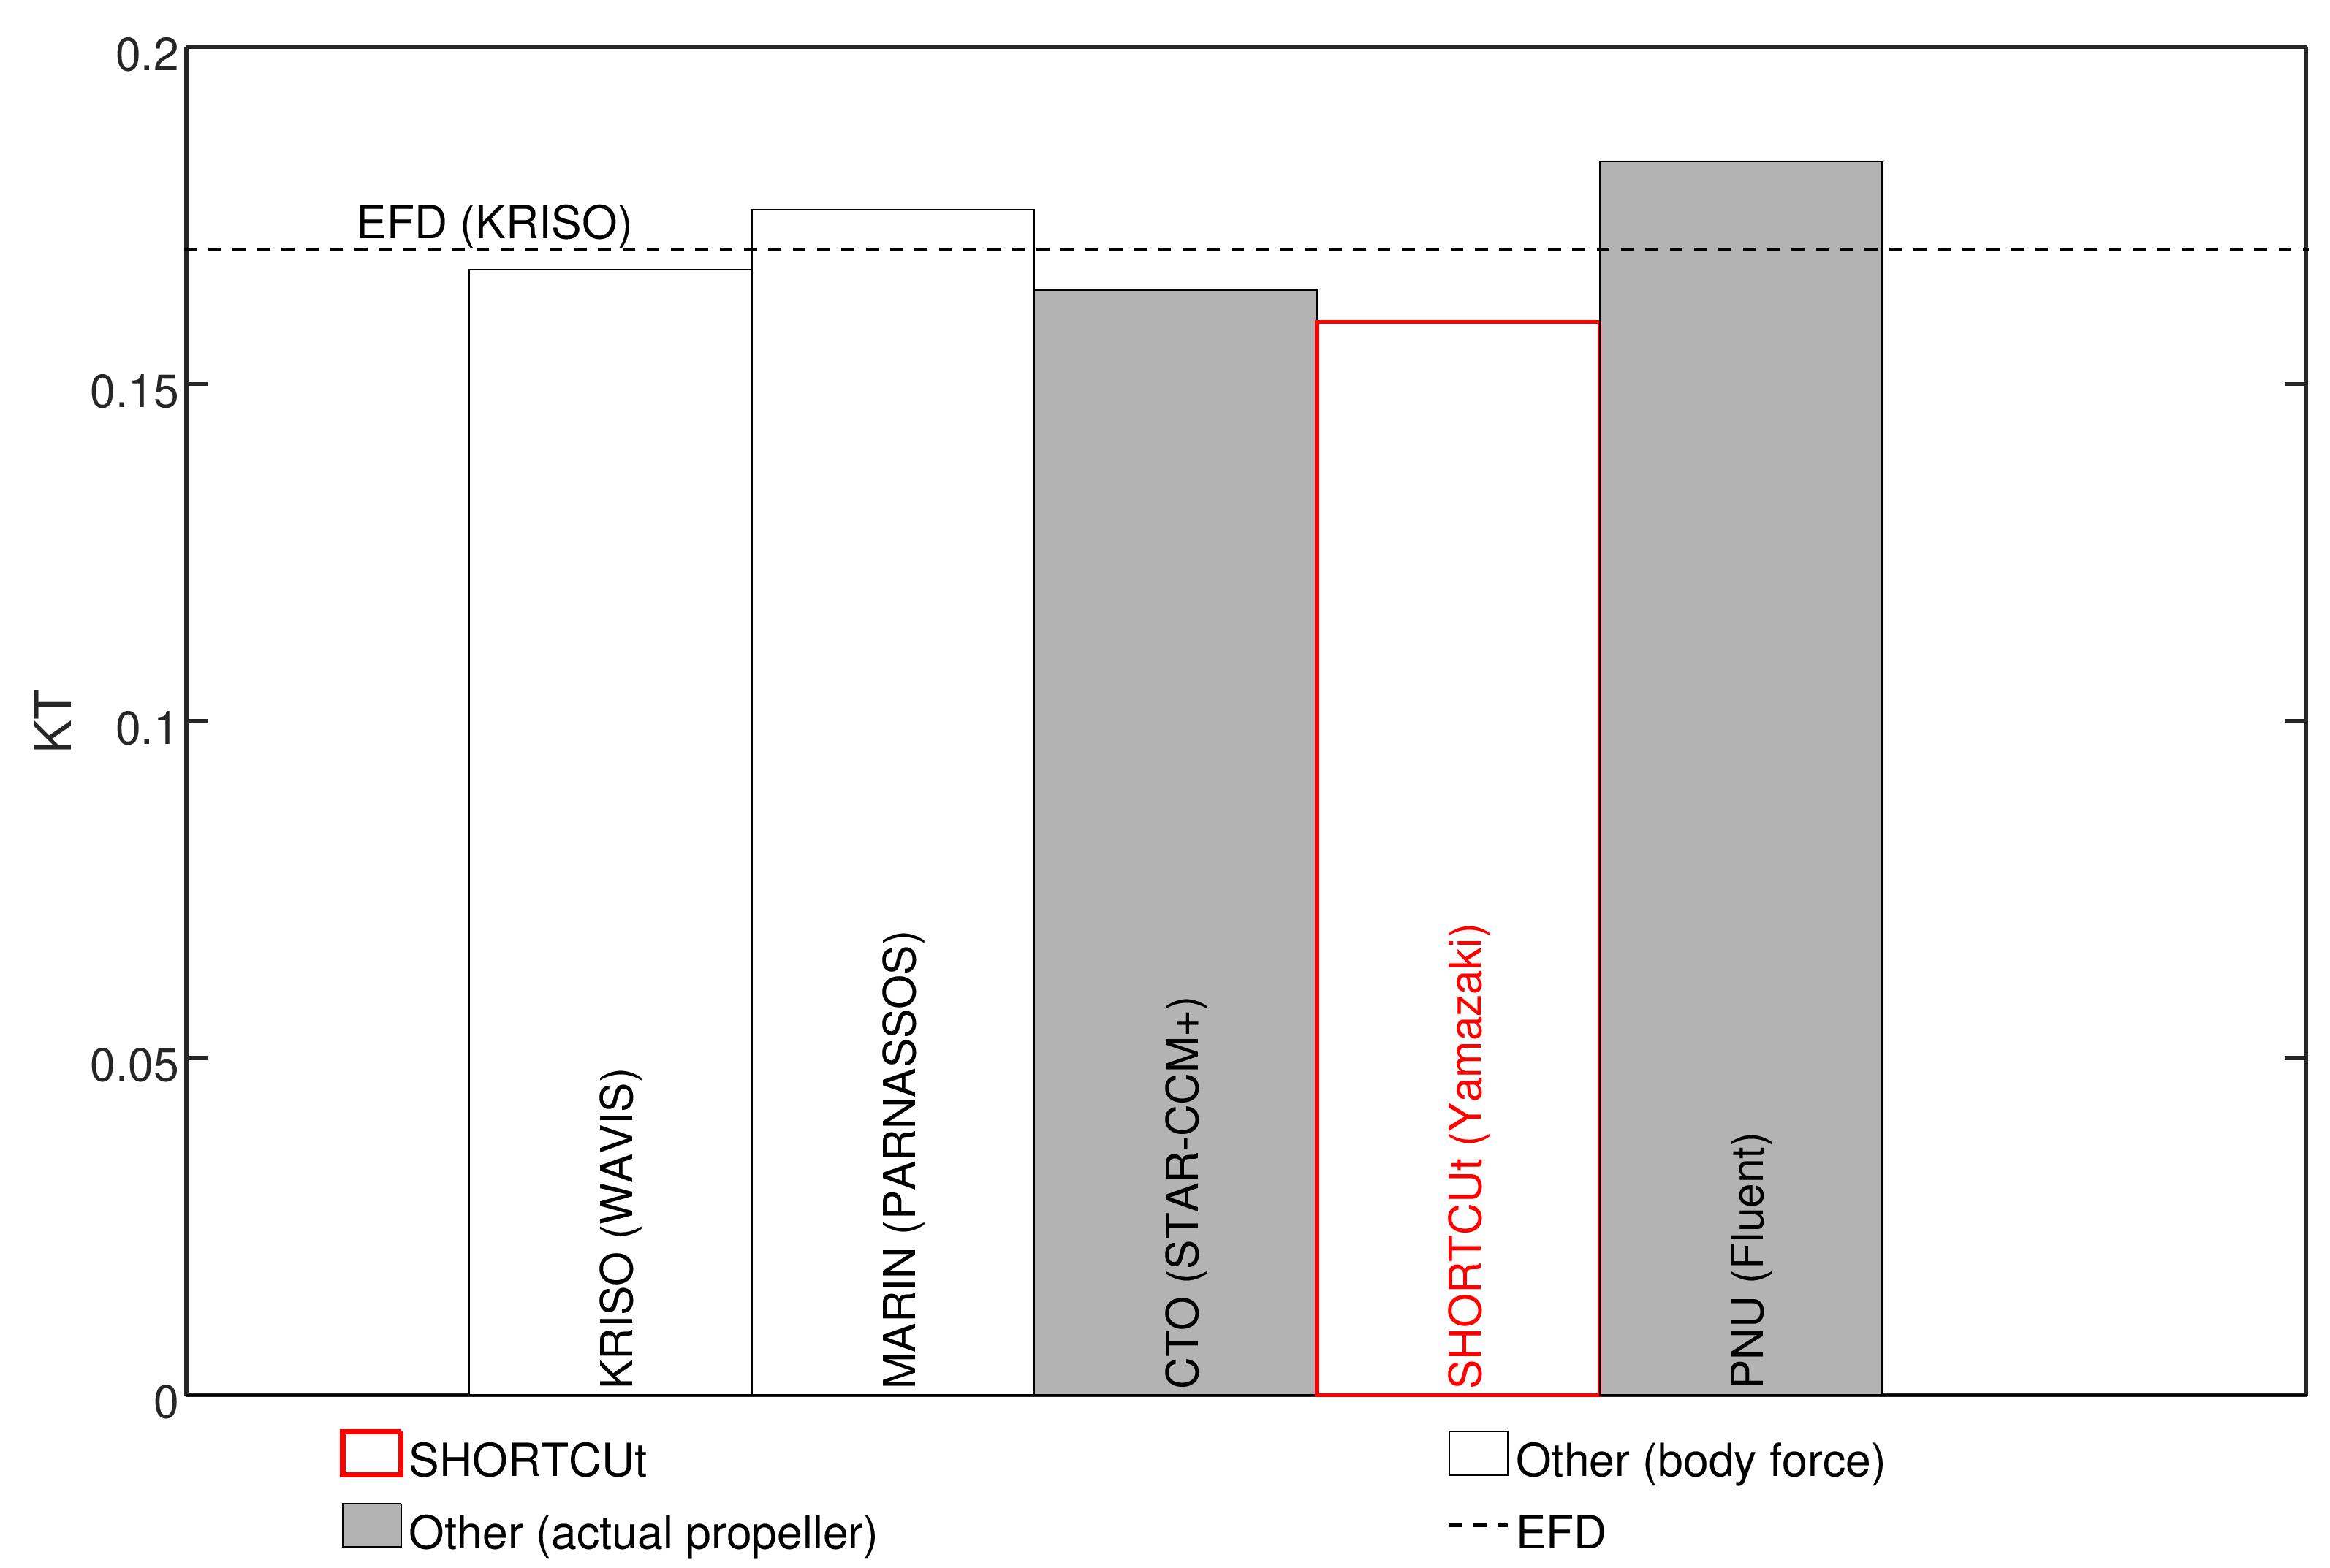
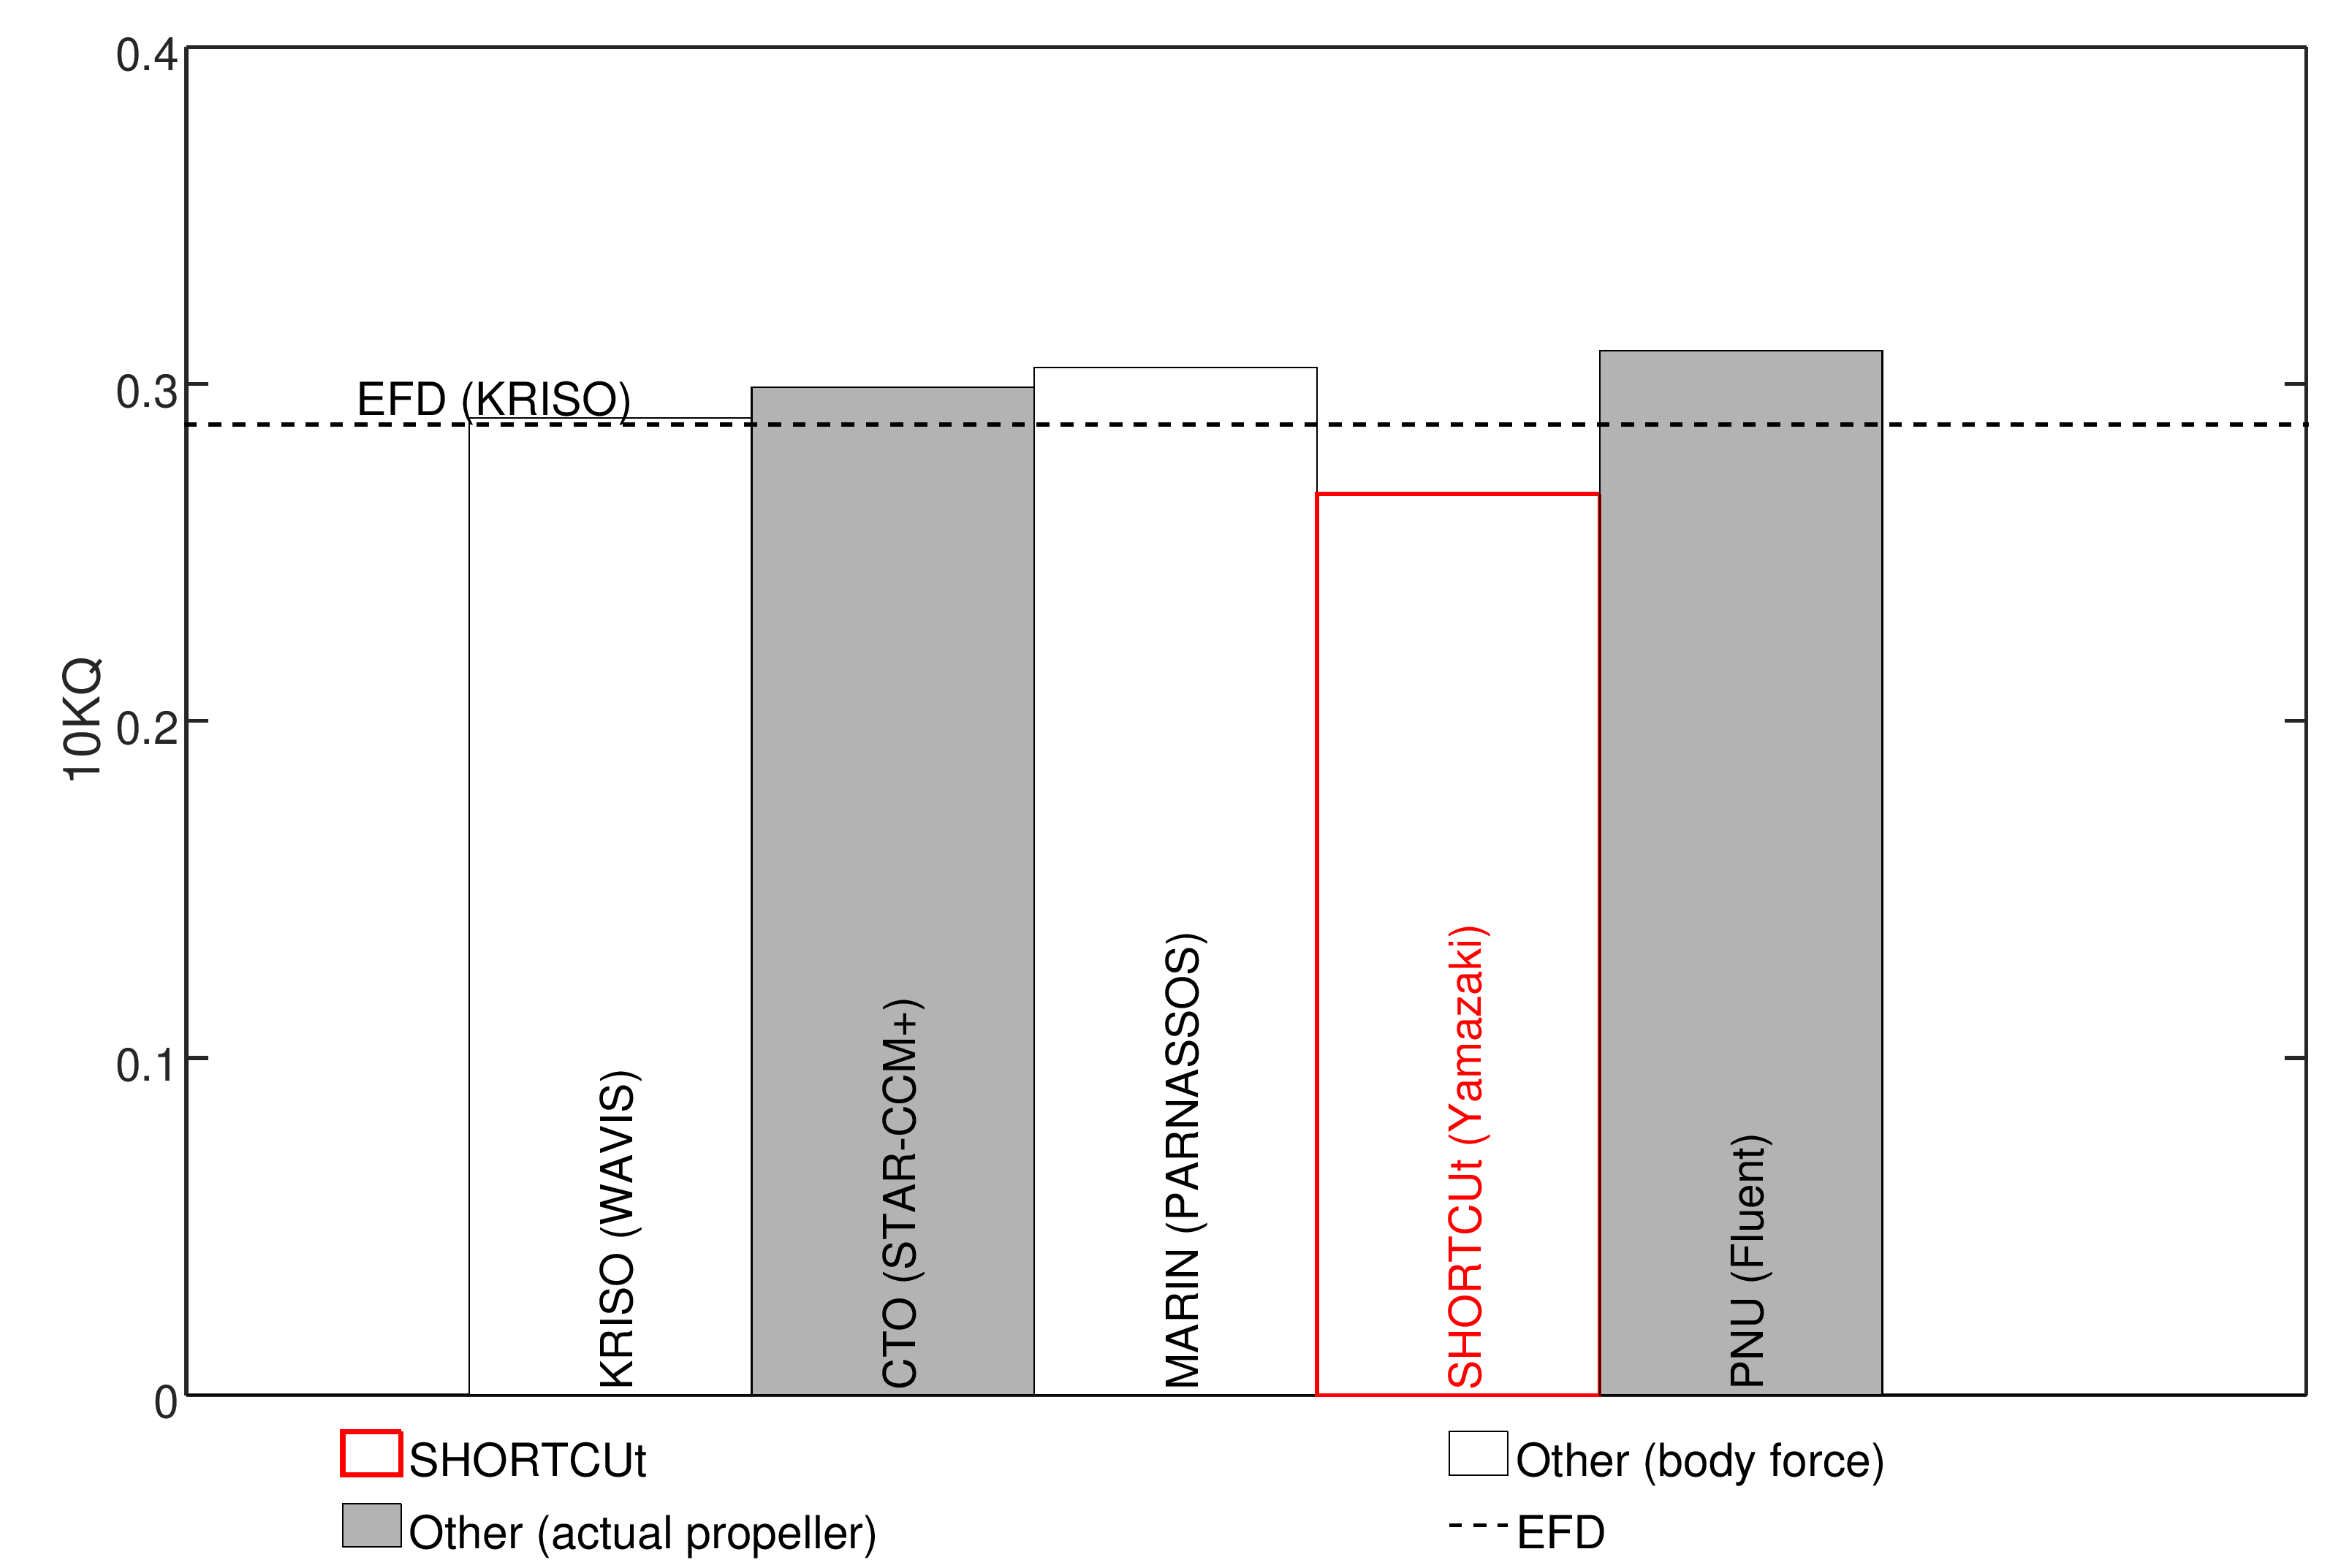
Comparison of estimated RPM for self propulsion and associated propulsion coefficients of the KCS. SHORTCUt results compared with experiments and other submissions to the benchmark case.
Finally; these results were obtained on a standard laptop using 3 cores. The specifications of the machine and the computational effort required are detailed below.
The KVLCC2 is a benchmark case for determining the flow around a modern tanker. Experimental data regarding the resistance of the KVLCC2 has been used for benchmarking in several recent marine CFD workshops. This data was complemented with PIV wake measurements and performance data for the self propelled KVLCC2 in calm water by Win et.al. (2016).
The experimental data presented by Win et.al. (2016) is used here to validate the selp propulsion calculations of the KVLCC2 using SHORTCUt; with and without the rudder present. In the experiments, the propeller RPM was set to the model self propulsion point. To match this, the SHORTCUt "fixedRPM" controller was used to keep the RPM fixed at the same model point. This calculation is identical to the one obtained with SHORTCUts (v. 0.12) KVLCC2 tutorial settings.
| Property | Model Scale | |
|---|---|---|
| Lpp | 3.2m | |
| Fn(Lpp) | 0.142 (0.795 m/s) | |
| Wetted surface area | 2.7194 m2 | |
| Propeller | ||
| Diameter | 0.0986m | |
| No. blades | 4 | |
| Rotation direction | Clockwise | |
| Property | EFD Win et.al. (2016) | SHORTCUt | CFD Win et.al. (2016) |
|---|---|---|---|
| n | 16.5 rps (model point) | 16.5 rps (fixed) | 16.5 rps (fixed) |
| Without rudder | |||
| Kt | 0.1949 | 0.1949 | 0.1985 |
| Kq | 0.0266 | 0.0212 | 0.0221 |
| With rudder | |||
| Kt | 0.1983 | 0.2113 | 0.2031 |
| Kq | 0.0228 | 0.0223 | 0.0222 |
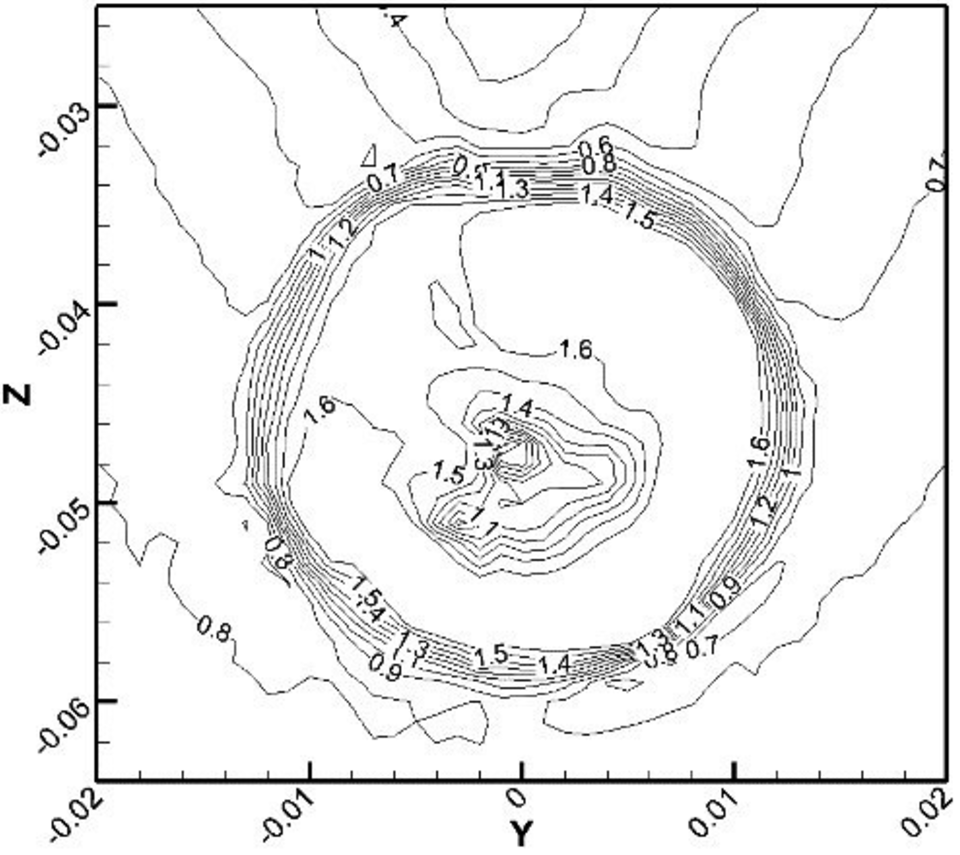
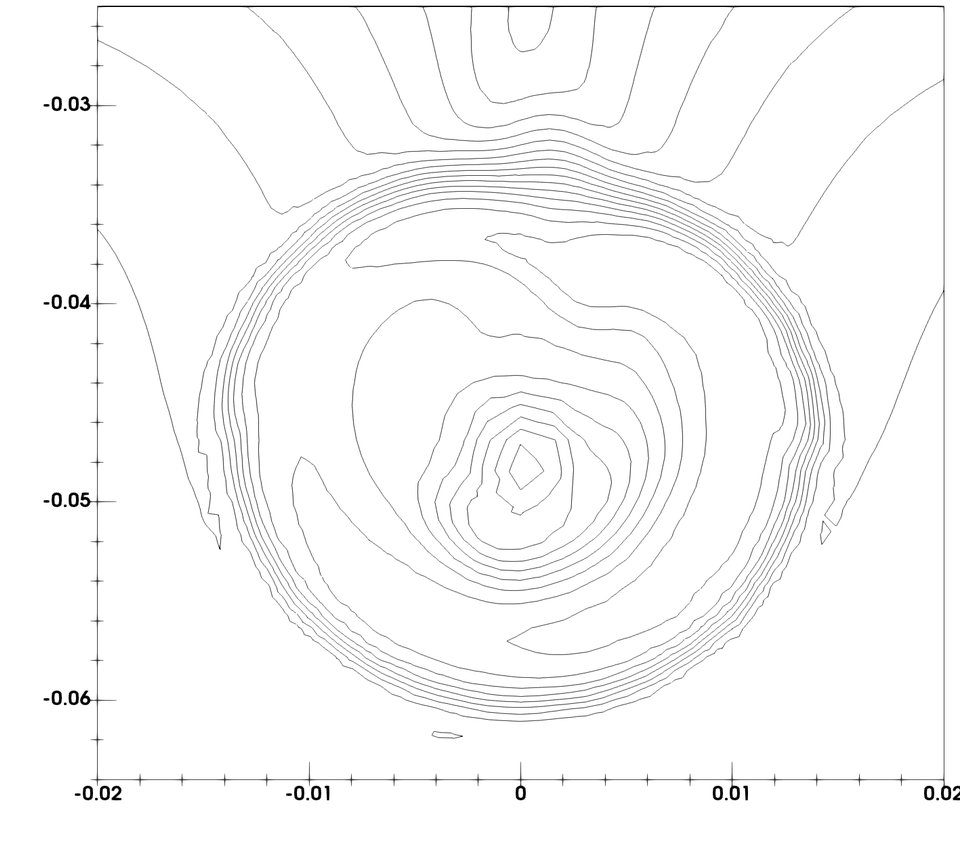
Local axial flow (Ux) at x/Lpp=0.4989. Without rudder.
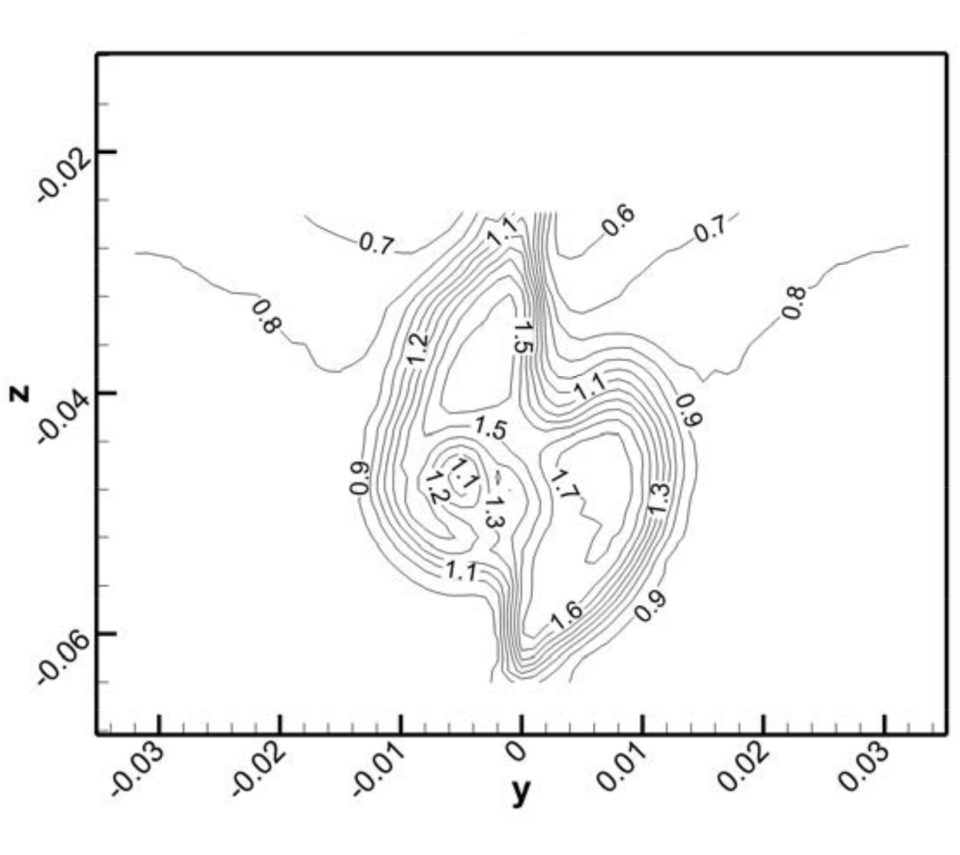
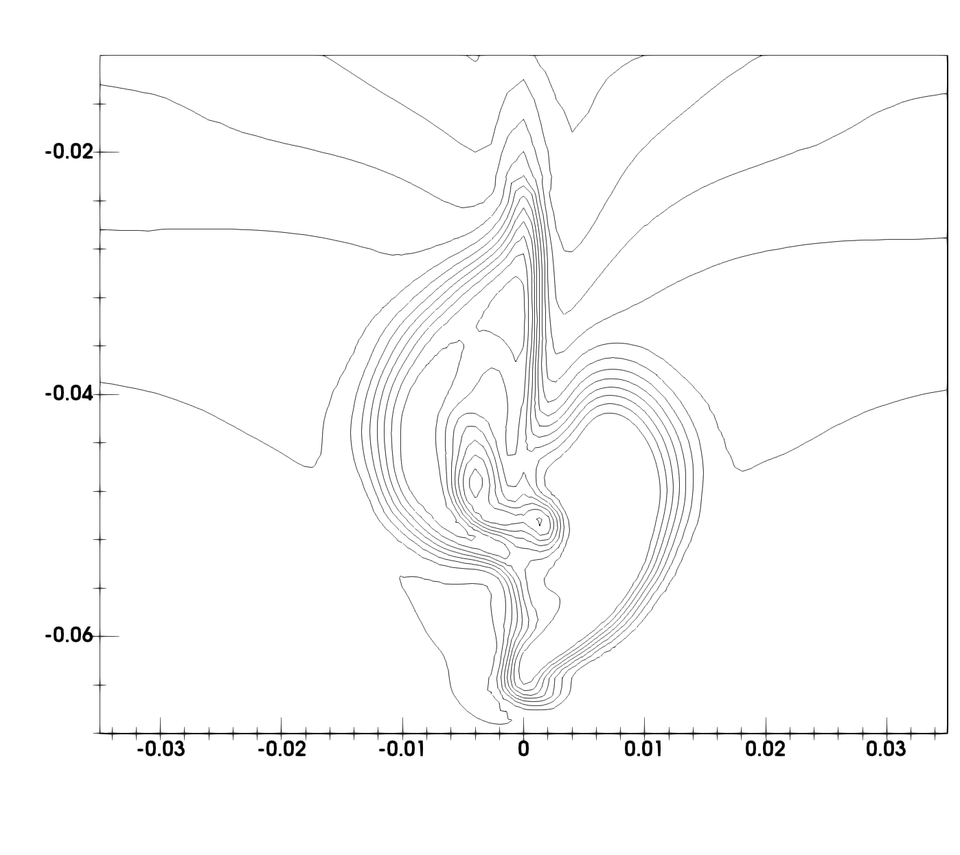
Local axial flow (Ux) at x/Lpp=0.525. With rudder.
The ship wake is slightly misaligned compared to the PIV. It is possible that this is due to the model being trimmed bow down in the experiment while being kept on an even keel in the SHORTCUt simulation. SHORTCUt offers the capability to trim the model in the simulations; but this functionality was not used in this comparison. Overall, the correlation between the PIV results and the computed wake is good in the region of interest (behind the propeller and near the rudder.)
Finally; these results were obtained on a standard laptop using 3 cores. The specifications of the machine and the computational effort required are detailed below.
Coming soon.